Overview of TXN’s Elliott Wave Analysis

This Elliott Wave analysis highlights bullish momentum across both daily and 1-hour charts for Texas Instruments Inc. (TXN), indicating further upside potential.

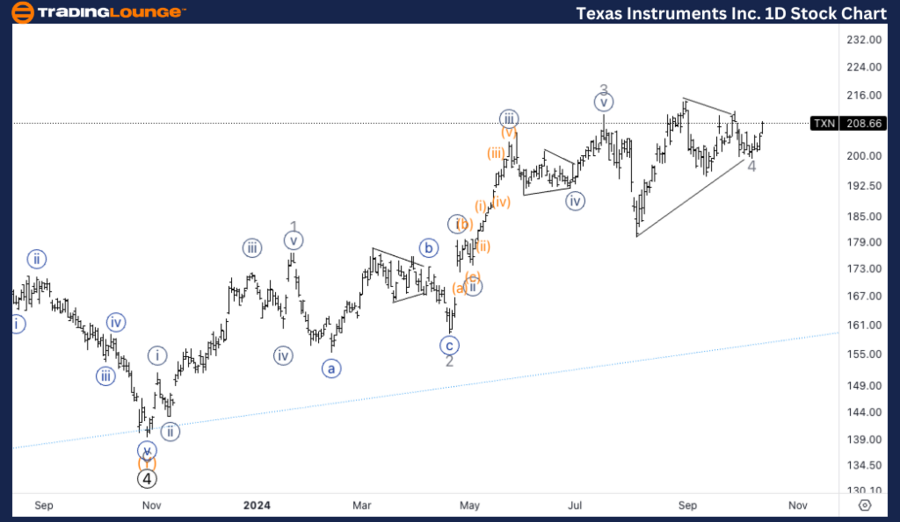
TXN Elliott Wave Analysis – Trading Lounge Day Chart

Texas Instruments Inc. (TXN) Daily Chart

TXN Elliott Wave Technical Analysis

Function: Trend

Mode: Impulsive

Structure: Motive

Position: Wave 4

Direction: Upside in Wave 5

Details: The daily chart shows TXN in the final stages of a triangle pattern within wave 4, suggesting a consolidation phase nearing completion. Given that wave 3 previously reached equality with wave 1, there’s a strong chance for an extension in the forthcoming wave 5. A breakout from the triangle formation could ignite an upward rally, marking the start of wave 5.

Key Insights from the Daily Chart

  • Wave 4 is shaping a triangle pattern, reflecting a consolidation period.
  • A breakout into wave 5 is expected, potentially driving the price higher.
  • Wave 3's equality with wave 1 signals the possibility of an extended wave 5 rally.

Texas-Instruments-In...


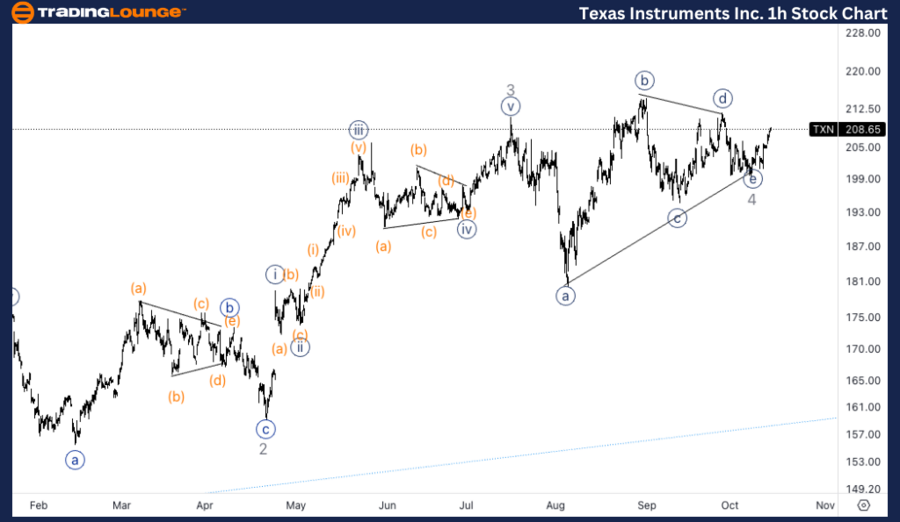
TXN Elliott Wave Analysis – Trading Lounge 1-Hour Chart

Texas Instruments Inc. (TXN) 1-Hour Chart

TXN Stock Technical Analysis

Function: Trend

Mode: Impulsive

Structure: Motive

Position: Bottom in wave {e}

Direction: Upside in wave {i}

Details: On the 1-hour chart, TXN seems to have concluded its correction, with wave {e} marking the end of wave 4. The current upward movement, unfolding in wave {i}, particularly in wave (iii) of {i}, indicates renewed bullish momentum. This development confirms the beginning of the anticipated wave 5 rally.

Key Insights from the 1-Hour Chart

  • The correction phase appears complete with wave {e}.
  • TXN is advancing in wave {i}, specifically within wave (iii) of {i}, hinting at stronger upward momentum.
  • This movement signals the initial phase of the projected wave 5 rally.

Technical Analyst: Alessio Barretta

Source: visit Tradinglounge.com and learn From the Experts Join TradingLounge Here 

See Previous: UnitedHealth Group Inc. (UNH) Elliott Wave Technical Analysis

VALUE Offer - Buy 1 Month & Get 3 Months!Click here

Access 7 Analysts Over 200 Markets Covered. Chat Room With Support

Texas-Instruments-In...

Related

Nifty 50 Elliott Wave Analysis Highlights Bullish Impulse With Key Wave Counts and Support Levels for Informed Trading Strategy

Nifty 50 Elliott Wave Analysis Highlights Bullish Impulse With Key Wave Counts and Support Levels for Informed Trading Strategy

This article analyses Nifty 50 using Elliott Wave theory, identifying bullish trends and impulsive w...

Read More >
QUALCOMM Inc. (QCOM) Stocks Elliott Wave Technical Analysis: Monitor Key Levels to identify Potential Entry and Exit Points

QUALCOMM Inc. (QCOM) Stocks Elliott Wave Technical Analysis: Monitor Key Levels to identify Potential Entry and Exit Points

This QCOM Elliott Wave analysis provides traders with insights into QUALCOMM's stock forecast, p...

Read More >
SuperMicro Computers Inc. (SMCI) Elliott Wave Forecast: Final Wave {v} & $50 Breakout Setup for Bullish SuperMicro Stock Trend Return

SuperMicro Computers Inc. (SMCI) Elliott Wave Forecast: Final Wave {v} & $50 Breakout Setup for Bullish SuperMicro Stock Trend Return

SMCI Elliott Wave analysis shows SuperMicro nearing completion of corrective flat on daily chart (wa...

Read More >
Explores the Current Stock Trends: NEWS CORPORATION. – NWS Stock Analysis & Elliott Wave Technical Forecast

Explores the Current Stock Trends: NEWS CORPORATION. – NWS Stock Analysis & Elliott Wave Technical Forecast

This detailed analysis provides an in-depth Elliott Wave forecast for ASX: News Corporation (NWS). T...

Read More >
Elliott Wave Forecast: Bullish Trends & Trading Strategies for SP500, NASDAQ, DAX, FTSE & ASX 200

Elliott Wave Forecast: Bullish Trends & Trading Strategies for SP500, NASDAQ, DAX, FTSE & ASX 200

Summary: Elliott Wave Market Analysis & Trading Strategy Markets Covered: S&P 500 (SPX), NASDAQ 100...

Read More >
URW Elliott Wave Analysis for ASX Stock Unibail Rodamco Westfield Provides Critical Insights into Potential Stock Price Movements

URW Elliott Wave Analysis for ASX Stock Unibail Rodamco Westfield Provides Critical Insights into Potential Stock Price Movements

Our latest Elliott Wave analysis for ASX UNIBAIL-RODAMCO-WESTFIELD (URW) provides critical insights ...

Read More >

$1 for 2 Weeks

then $29 a month!

What a Special Offer!

Trade Recommendations

Unleash the power of deversified trading with our comprehensive portfolio, covering 250+ markets:

  • Stock Trades
  • Crypto Trades
  • Forex Trades
  • Commodity Trades
Elliott Wave Analysis

Gain a competitive edge with expert insights and AI-powered Elliott Wave charting into:

  • Global Indices
  • US Stocks & ASX Stocks
  • Forex & Crypto
  • Commodities
Top-Notch Trading Tools

Equip yourself with the tools of success:

  • Real-time Chat rooms
  • Elliott Wave Algorithm
  • Portfolio tools
  • TradingLevels
  • Screener
  • Trading Game
7 Elliott Wave Analysts

Stay ahead of the market with daily charts and insightful videos
Your secret to strategic trading!

JOIN HERE


Welcome to TradingLounge (ASIC A.R.No. 321187), specialists in trades, trading education and technical analysis, covering stocks, indices, commodities, forex and cryptocurrencies.

When you join TradingLounge you have access to everything we offer, including trade tools, educational content and a social platform to chat with like-minded investors.

Read more

@Copyright 2024 by tradinglounge.com

Contact Us

Australian no: 02 4787 6020

International no: +61 (2) 47876020

Pay with:

Find us on