Chevron Inc. (CVX) – Elliott Wave Analysis by TradingLounge Daily Chart
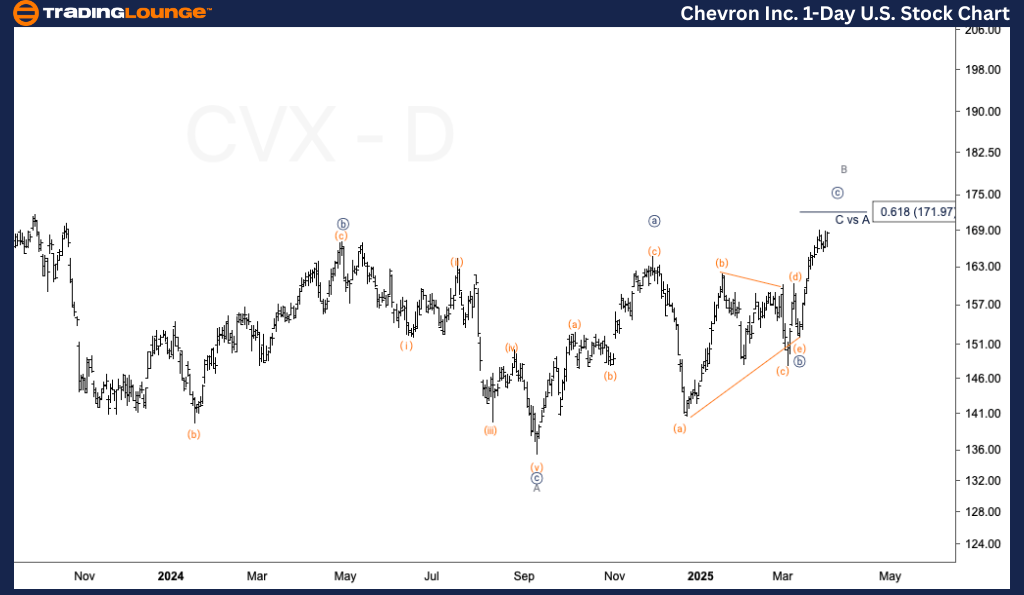
CVX Elliott Wave Forecast
Function: Counter Trend
Mode: Corrective
Structure: Flat Pattern
Position: Wave {c} of B
Direction: Forecasting a peak in wave B
Details: The current market behavior for Chevron Inc. (CVX) suggests a corrective formation within Minor wave B. Technical indicators show a likely top approaching, which may signal the beginning of a deeper decline, extending the overall corrective sequence.

Chevron Inc. (CVX) – Elliott Wave Analysis by TradingLounge 1-Hour Chart
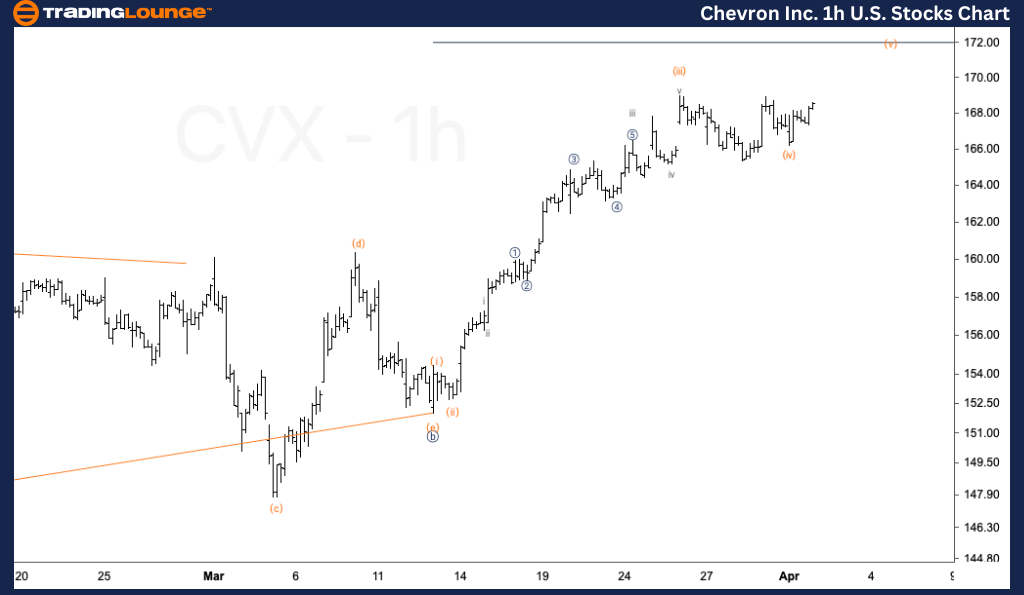
Function: Counter Trend
Mode: Corrective
Structure: Flat Pattern
Position: Wave (iv) of {c}
Direction: Expected move upward into wave (v)
Details: The short-term Elliott Wave analysis for Chevron (CVX) points to a potential final advance within wave (v), aiming toward the 0.618 Fibonacci projection of wave {c} relative to {a}. This target aligns with the $172 resistance area, situated at the midpoint of MG2. A price reaction and reversal from this level could confirm the completion of wave B.
Technical Analyst: Alessio Barretta
Source: Visit Tradinglounge.com and learn from the Experts. Join TradingLounge Here
Previous: KO – The Coca-Cola Elliott Wave Technical Analysis
VALUE Offer - Buy 1 Month & Get 3 Months!Click here
Access 7 Analysts Over 200 Markets Covered. Chat Room With Support
