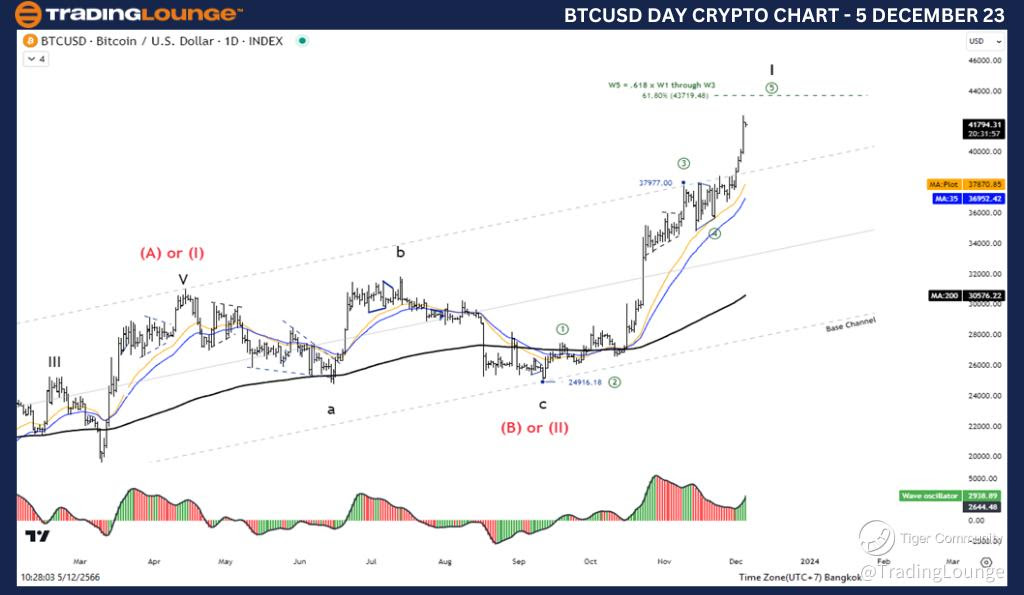
Elliott Wave Analysis TradingLounge Daily Chart, 5 December 23,
Bitcoin/ U.S. dollar(BTCUSD)
BTCUSD Elliott Wave Technical Analysis
Function: Follow Trend
Mode: Motive
Structure: Impulse
Position: Wave((5))
Direction Next higher Degrees: wave I of Impulse
Wave Cancel invalid level:
Details: Wave 4 may end and the price entering to wave 5
Bitcoin/ U.S. dollar(BTCUSD)Trading Strategy :Bitcoin continues to soar But it is the rise of the fifth wave that will provide early warning of a correction or trend change. and has a chance to reach the level 43719.48, which is equal to 61.8% of the length of wave 1 to wave 3.
Bitcoin/ U.S. dollar(BTCUSD)Technical Indicators: The price is above the MA200 indicating an uptrend, Wave Oscillators a Bullish Momentum.
TradingLounge Analyst: Kittiampon Somboonsod, CEWA
Source: Tradinglounge.com get trial here!
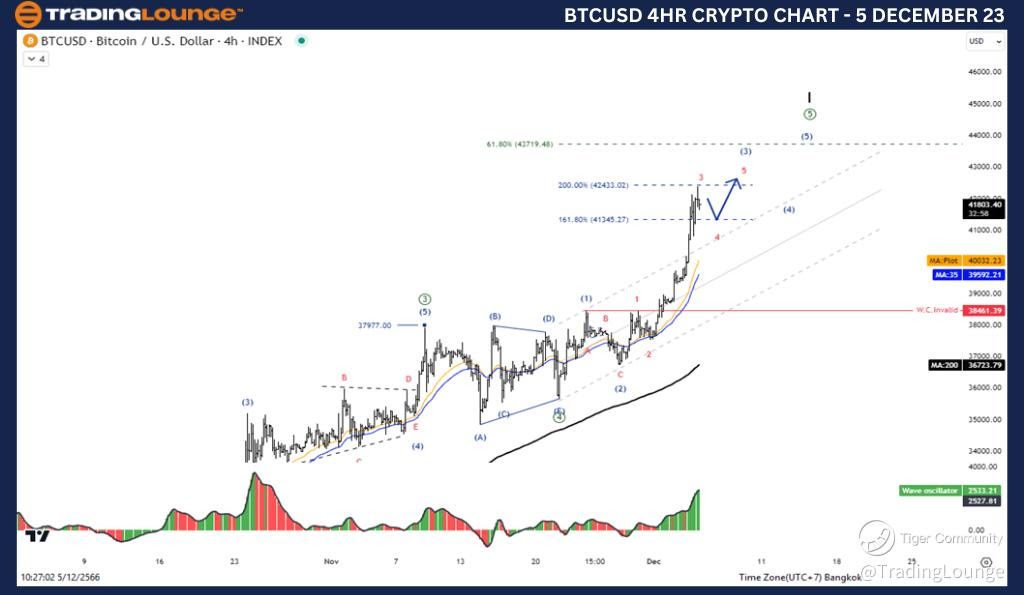
Elliott Wave Analysis TradingLounge 4H Chart, 5 December 23,
Bitcoin/ U.S. dollar(BTCUSD)
BTCUSD Elliott Wave Technical Analysis
Function: Follow Trend
Mode: Motive
Structure: Impulse
Position: Wave((5))
Direction Next higher Degrees: wave I of Impulse
Wave Cancel invalid level:
Details: Wave 4 may end and the price entering to wave 5
Bitcoin/ U.S. dollar(BTCUSD)Trading Strategy: Bitcoin continues to soar But it is the rise of the fifth wave that will provide early warning of a correction or trend change. and has a chance to reach the level 43719.48, which is equal to 61.8% of the length of wave 1 to wave 3.
Bitcoin/ U.S. dollar(BTCUSD)Technical Indicators: The price is above the MA200 indicating an uptrend, Wave Oscillators a Bullish Momentum.