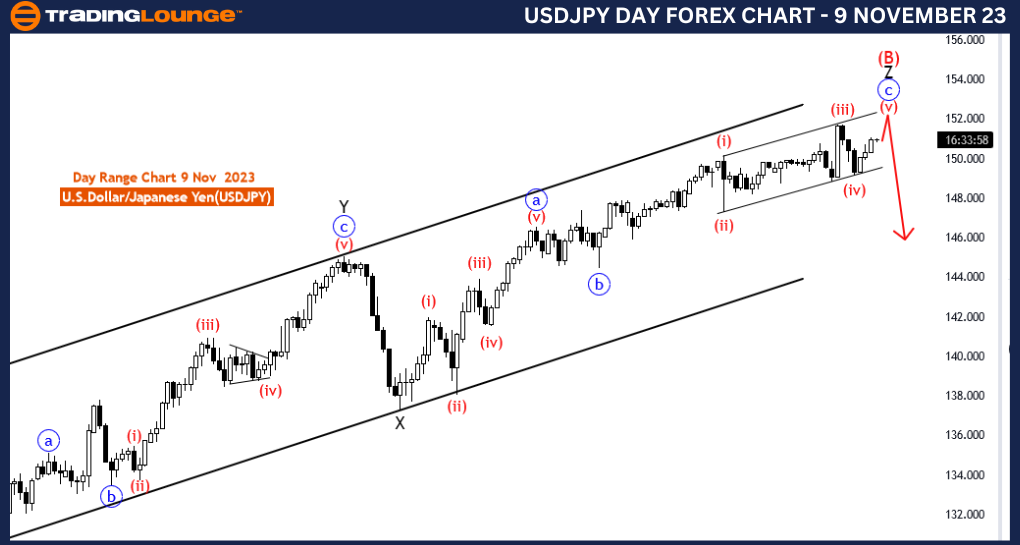
USDJPY Elliott Wave Analysis Trading Lounge Day Chart, 9 November 23
U.S.Dollar/Japanese Yen (USDJPY) Day Chart
USDJPY Elliott Wave Technical Analysis
Function: Counter Trend
Mode: Motive(ending diagonal)
Structure: red wave 5 of C
Position: Z OF B
Direction Next Lower Degrees: new Downtrend
Details: wave 4 of C is looking completed at 149.185 , now wave 5 of C is in play and near to end , after that new downtrend expected
The "USDJPY Elliott Wave Analysis Trading Lounge Day Chart" for 9 November 23, provides valuable insights into the dynamics of the U.S. Dollar/Japanese Yen (USDJPY) currency pair. It employs Elliott Wave theory to forecast potential market developments and offers traders a comprehensive perspective.
The analysis defines the market's "Function" as "Counter Trend," indicating that the current price movement goes against the prevailing trend. This is essential information for traders looking to profit from short-term fluctuations.
It characterizes the "Mode" as "Motive (ending diagonal)." A "Motive" mode suggests that the market is in a directional phase, and the reference to an "ending diagonal" implies a probable terminal pattern, typically found in the latter stages of a trend.
The analysis outlines the "Structure" of the market as "red wave 5 of C." This signifies that the market is currently in the fifth wave of a broader corrective pattern, likely a part of a complex Elliott Wave structure.
The "Position" is identified as "Z OF B," indicating a significant point within a corrective pattern. In Elliott Wave theory, "B" waves are often part of complex corrections preceding the final wave of a larger structure.
In the "Direction" aspect of lower degrees, the analysis states a "new Downtrend." This is a pivotal insight for traders, suggesting that the correction discussed may be the precursor to a more extensive downward trend. Traders can utilize this information to make well-informed trading decisions.
The analysis underlines the status of "wave 4 of C," indicating that this specific sub-wave of the correction has possibly completed at 149.185. Understanding which sub-wave is unfolding is crucial for traders in evaluating potential price targets and reversal points.
An essential reference point, the "Wave Cancel invalid level," is highlighted at 149.125. This level is of great significance in risk management and trade decision-making. A breach of this level might indicate a shift in the anticipated market structure.
To sum up, the USDJPY Elliott Wave Analysis on the Day Chart suggests a Counter Trend scenario characterized by a Motive Mode, specifically an ending diagonal structure. The market is currently navigating the fifth wave of the correction (wave 5 of C), and a "new Downtrend" is expected to follow. Traders should closely monitor the Wave Cancel invalid level at 149.125 as it represents a crucial point for risk management.
Technical Analyst : Malik Awais
Source : Tradinglounge.com get trial here!

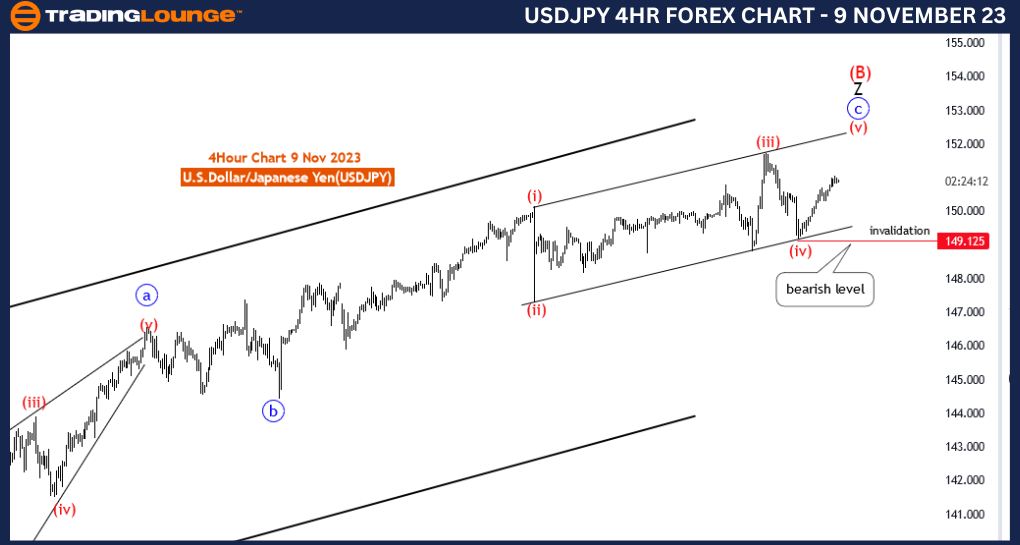
USDJPY Elliott Wave Analysis Trading Lounge 4 Hour Chart, 9 November 23
U.S.Dollar/Japanese Yen (USDJPY) 4 Hour Chart
USDJPY Elliott Wave Technical Analysis
Function: Counter Trend
Mode: Motive(ending diagonal)
Structure: red wave 5 of C
Position: Z OF B
Direction Next Lower Degrees: new Downtrend
Details: wave 4 of C is looking completed at 149.185 , now wave 5 of C is in play and near to end. Wave Cancel invalid level: 149.125
The "USDJPY Elliott Wave Analysis Trading Lounge 4 Hour Chart" for 9 November 23, focuses on the intricacies of the U.S. Dollar/Japanese Yen (USDJPY) currency pair. Utilizing Elliott Wave theory, it offers insights into potential market movements and trading strategies.
The analysis categorizes the market function as "Counter Trend." This suggests that the USDJPY pair is currently undergoing a reversal or correction against the prevailing trend. Understanding this context is vital for traders aiming to capitalize on short-term price movements.
It identifies the "Mode" as "Motive (ending diagonal)." A Motive mode typically indicates that the market is engaged in a directional move. The reference to an "ending diagonal" implies that this directional movement may be part of a terminal pattern, often occurring in the final stages of a trend.
The analysis specifies the market's "Structure" as "red wave 5 of C." This indicates that the market is currently in the fifth wave of a larger corrective pattern, potentially part of a complex Elliott Wave structure.
The "Position" is noted as "Z OF B," implying that the market is at a significant juncture within a corrective structure. In Elliott Wave theory, "B" waves are often part of complex corrections that precede the final wave.
The "Direction" in the lower degrees is labeled as a "new Downtrend." This is a crucial piece of information for traders, as it suggests that the correction discussed in this analysis might be the precursor to a broader downward trend. Traders may use this information to make informed decisions.
The analysis highlights the ongoing status of "wave 5 of C," indicating that this specific sub-wave within the correction is in play. Understanding which sub-wave is unfolding can be instrumental for traders in evaluating potential price targets and reversal points.
A critical reference point is identified as the "Wave Cancel invalid level," situated at 149.125. This level is of paramount importance in managing risk and trade decisions. A breach of this level could signal a change in the anticipated market structure.
In summary, the USDJPY Elliott Wave Analysis suggests a Counter Trend scenario with a Motive Mode in the form of an ending diagonal structure. The market is currently navigating the fifth wave of the correction (wave 5 of C). Moreover, traders should closely monitor the Wave Cancel invalid level at 149.125 as it represents a pivotal point for managing risk.
Technical Analyst: Malik Awais
Source : Tradinglounge.com get trial here!
