18Dec

ASX:IAG Elliott Wave Analysis, Stock Forecast, Price Trends, Wave Patterns, Market Insights, and Trading Strategies for Investors

ASX: INSURANCE AUSTRALIA GROUP LIMITED (IAG) Elliott Wave Technical Analysis | TradingLounge

Introduction

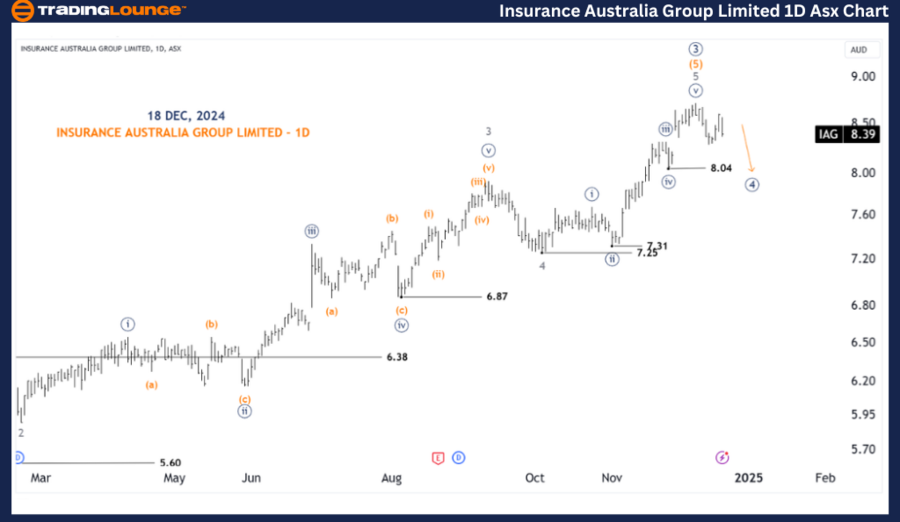
Welcome to today’s Elliott Wave analysis, focusing on the Australian Stock Exchange (ASX) and INSURANCE AUSTRALIA GROUP LIMITED (ASX:IAG). Our current wave analysis suggests that ASX:IAG may continue its downward trajectory with wave ((4))-navy in the near term. Below, we provide a detailed breakdown of our technical observations.


ASX: IAG 1D Chart Analysis (Semilog Scale)

IAG Elliott Wave Technical Analysis

Function: Major trend (Intermediate degree, orange)

Mode: Motive

Structure: Impulse

Position: Wave ((4))-navy

Details:

  • Wave ((3))-navy has likely concluded as a five-wave sequence, progressing from (1)-orange to (5)-orange.
  • Wave ((4))-navy appears to be moving lower, with a probable target near the 7.25 low.
  • To maintain this view, prices must stay below the 8.60 high.

Invalidation Point: 8.60

INSURANCE-AUSTRALIA-...


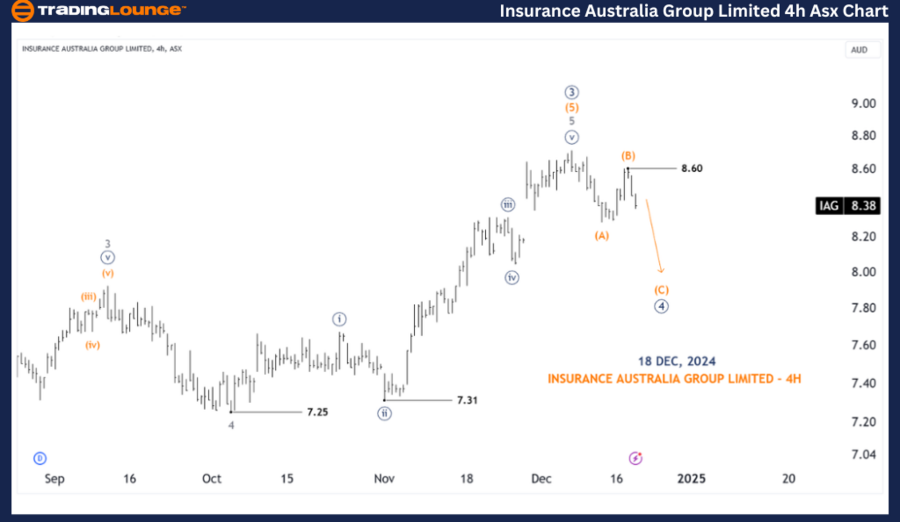
ASX:IAG 4-Hour Chart Analysis

Function: Major trend (Intermediate degree, orange)

Mode: Motive

Structure: Impulse

Position: Wave (C)-orange of Wave ((4))-navy

Details:

  • A closer examination shows that wave ((4))-navy is unfolding as a Zigzag pattern labeled (A)(B)(C)-orange.
  • Alternatively, it might develop as a (1)(2)(3)-orange structure, although this distinction does not significantly impact the expectation of further downward movement.
  • The price action continues to suggest bearish momentum.

Invalidation Point: 8.60

Technical Analyst: Hua (Shane) Cuong, CEWA-M (Master’s Designation).

Source: visit Tradinglounge.com and learn From the Experts Join TradingLounge Here 

See Previous: BRAMBLES LIMITED - BXB Elliott Wave Technical Analysis 

VALUE Offer - Buy 1 Month & Get 3 Months!Click here

Access 7 Analysts Over 200 Markets Covered. Chat Room With Support

INSURANCE-AUSTRALIA-...


Conclusion

This Elliott Wave analysis for ASX: INSURANCE AUSTRALIA GROUP LIMITED (ASX:IAG) highlights current market dynamics and actionable insights. Our forecast includes specific price levels for validation and invalidation of the wave count, adding clarity and confidence to the analysis. By leveraging these structured observations, traders can better navigate the market trends with precision and objectivity.

Related

Effective Trading Strategies: Chainlink Crypto Price News Today Elliott Wave Technical Analysis

Effective Trading Strategies: Chainlink Crypto Price News Today Elliott Wave Technical Analysis

This article provides an in-depth Elliott Wave Analysis for ChainLink (LINKUSD), offering insights i...

Read More >
Day and 4-hour Chart for British Pound/U.S.Dollar (GBPUSD) Elliott Wave Technical Analysis

Day and 4-hour Chart for British Pound/U.S.Dollar (GBPUSD) Elliott Wave Technical Analysis

Our GBP/USD Elliott Wave Analysis for the 4-hour chart on 13 March 24 suggests an ongoing impulsive ...

Read More >
Bajaj Finance Elliott Wave Analysis - Stock Forecast, Trading Levels, Price Projection, and Market Trend for 2024

Bajaj Finance Elliott Wave Analysis - Stock Forecast, Trading Levels, Price Projection, and Market Trend for 2024

Elliott Wave analysis of Bajaj Finance stock, outlining potential price movements, trend projections...

Read More >
Stay ahead with our forecast ASX Stock Analysis & Asx Limited Elliott Wave Technical Forecast

Stay ahead with our forecast ASX Stock Analysis & Asx Limited Elliott Wave Technical Forecast

Our detailed ASX Elliott Wave analysis provides expert technical insights into ASX LIMITED stock. Le...

Read More >
NIFTY 50 INDEX Elliott Wave Technical Analysis: Indian Stock Market Outlook Progressing Toward the 25,000-25,100 Range

NIFTY 50 INDEX Elliott Wave Technical Analysis: Indian Stock Market Outlook Progressing Toward the 25,000-25,100 Range

The NIFTY 50 Index is currently in a corrective wave pattern, progressing toward the 25,000-25,100 r...

Read More >
Maximize Your NASDAQ Trading Strategies with Elliott Wave Analysis

Maximize Your NASDAQ Trading Strategies with Elliott Wave Analysis

Leverage Elliott Wave Analysis for strategic trading in the NASDAQ stock market, focusing on key tec...

Read More >

$1 for 2 Weeks

then $29 a month!

What a Special Offer!

Trade Recommendations

Unleash the power of deversified trading with our comprehensive portfolio, covering 250+ markets:

  • Stock Trades
  • Crypto Trades
  • Forex Trades
  • Commodity Trades
Elliott Wave Analysis

Gain a competitive edge with expert insights and AI-powered Elliott Wave charting into:

  • Global Indices
  • US Stocks & ASX Stocks
  • Forex & Crypto
  • Commodities
Top-Notch Trading Tools

Equip yourself with the tools of success:

  • Real-time Chat rooms
  • Elliott Wave Algorithm
  • Portfolio tools
  • TradingLevels
  • Screener
  • Trading Game
7 Elliott Wave Analysts

Stay ahead of the market with daily charts and insightful videos
Your secret to strategic trading!

JOIN HERE


Welcome to TradingLounge (ASIC A.R.No. 321187), specialists in trades, trading education and technical analysis, covering stocks, indices, commodities, forex and cryptocurrencies.

When you join TradingLounge you have access to everything we offer, including trade tools, educational content and a social platform to chat with like-minded investors.

Read more

@Copyright 2024 by tradinglounge.com

Contact Us

Australian no: 02 4787 6020

International no: +61 (2) 47876020

Pay with:

Find us on