17Feb

Bajaj Finance Elliott Wave Analysis - Stock Forecast, Trading Levels, Price Projection, and Market Trend for 2024

BAJAJ FINANCE Elliott Wave Technical Analysis – BAJFINANCE (1D Chart)

BAJFINANCE  Elliott Wave Technical Analysis

Function: Larger Degree Trend Higher (Intermediate Degree Orange)

Mode: Motive

Structure: Impulse

Position: Minor Wave 3 Grey

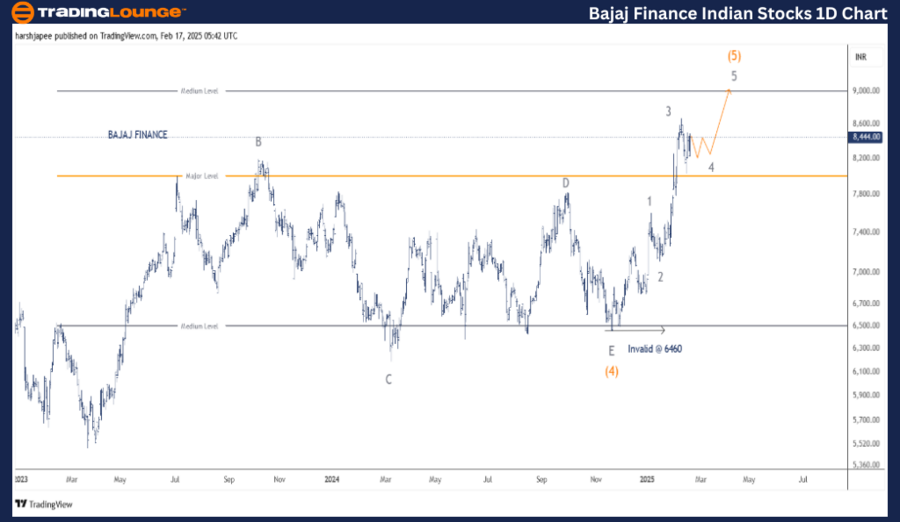
Details: Minor Wave 3 Grey is advancing higher, targeting levels beyond 6460.

Invalidation Point: 6460

BAJAJ FINANCE Daily Chart Technical Analysis & Elliott Wave Projections

The BAJAJ FINANCE (BAJFINANCE) daily chart suggests a strong bullish momentum, pushing towards the 9000–9200 zone as the stock completes its larger degree uptrend (Intermediate Wave (5) Orange).

  • A potential Minor Wave 4 could emerge as an expanded flat or a triangle before the final bullish wave unfolds.
  • Previously, Intermediate Wave (4) concluded around 6460 in November 2024, following a multi-year triangle correction that began in March 2023.
  • The ongoing Intermediate Wave (5) is unfolding as an impulsive structure, with one more bullish leg anticipated before the cycle completes.

BAJAJ-FINANCE-1d-sto...


BAJAJ FINANCE Elliott Wave Technical Analysis – BAJFINANCE (4H Chart)

BAJFINANCE Elliott Wave Technical Analysis

  • Function: Larger Degree Trend Higher (Intermediate Degree Orange)

  • Mode: Motive

  • Structure: Impulse

  • Position: Minor Wave 3 Grey

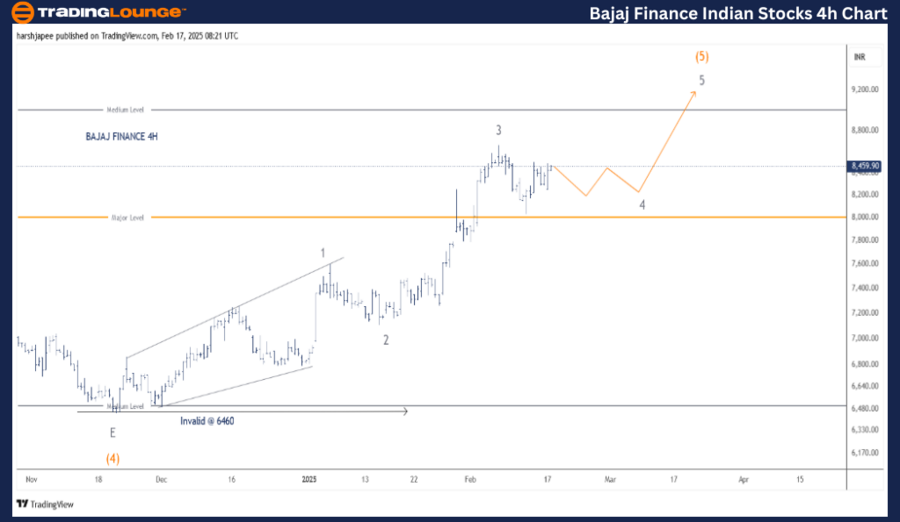
  • Details: Minor Wave 3 Grey is advancing higher against 6460, with a potential target of 8665 before a Wave 4 consolidation.

  • Invalidation Point: 6460

BAJAJ FINANCE 4H Chart Technical Analysis & Elliott Wave Outlook

The 4H chart provides a detailed breakdown of the sub-waves within Intermediate Wave (5) Orange, which commenced after Wave (4) completed as a triangle around 6460 in November 2024.

  • Wave (5) is progressing as an impulse, with a high probability of a bullish breakout above 9000 in the near term.
  • Wave Structure So Far:
    • Minor Wave 1: Formed as a leading diagonal, ending at 7600.
    • Wave 2: A sharp correction, retracing to 7120.
    • Wave 3: Surged higher, reaching 8665.
    • Wave 4 (Potential Formation): Expected as a triangle consolidation before the final upward push.

A crucial support level remains at 7600—as long as prices hold above this, bulls can maintain the impulsive uptrend.

Technical Analyst: Harsh Japee

Source: visit Tradinglounge.com and learn From the Experts Join TradingLounge Here 

Previous: HCL TECHNOLOGIES – HCLTECH Elliott Wave Technical Analysis

VALUE Offer - Buy 1 Month & Get 3 Months!Click here

Access 7 Analysts Over 200 Markets Covered. Chat Room With Support

BAJAJ-FINANCE-4h-sto...


Conclusion

BAJAJ FINANCE remains firmly bullish, advancing within Minor Wave 3 of Intermediate Wave (5), with 9000+ levels as the next major resistance zone. A potential short-term consolidation (Wave 4) may occur, but the larger trend remains upward in the coming sessions.

Related

META's Stock Movements: Meta Platforms Inc. (META) Stocks Elliott Wave Technical Analysis

META's Stock Movements: Meta Platforms Inc. (META) Stocks Elliott Wave Technical Analysis

This article provides a detailed Elliott Wave analysis of Meta Platforms Inc. (META). It covers META...

Read More >
Eaton Corp. PLC (ETN) Stocks Elliott Wave Technical Analysis: Focusing on its technical patterns through daily and 4-hour charts.

Eaton Corp. PLC (ETN) Stocks Elliott Wave Technical Analysis: Focusing on its technical patterns through daily and 4-hour charts.

This article provides a comprehensive Elliott Wave analysis of Eaton Corp. PLC (ETN), focusing on it...

Read More >
Explore our detailed ASX RIO TINTO LIMITED - RIO Stock Analysis & Elliott Wave Technical Forecast

Explore our detailed ASX RIO TINTO LIMITED - RIO Stock Analysis & Elliott Wave Technical Forecast

Explore our detailed ASX RIO Tinto Elliott Wave analysis and stock forecast. Learn about RIO TINTO L...

Read More >
Elliott Wave Analysis: Bearish and Bullish Scenarios for SP 500 and Nasdaq 100

Elliott Wave Analysis: Bearish and Bullish Scenarios for SP 500 and Nasdaq 100

The Elliott Wave analysis of the SP 500 and Nasdaq 100 indices suggests a predominant bearish trend ...

Read More >
Spotify Technology S.A. (SPOT) Elliott Wave Technical Analysis: Chart Trends, Identifies Key Support levels, and Provides Insights

Spotify Technology S.A. (SPOT) Elliott Wave Technical Analysis: Chart Trends, Identifies Key Support levels, and Provides Insights

Get the latest Spotify (SPOT) stock analysis using Elliott Wave Theory. Our detailed report covers d...

Read More >
Commodities & Futures Market Analysis: Elliott Wave Insights & Strategies

Commodities & Futures Market Analysis: Elliott Wave Insights & Strategies

The Commodities Market Trading Report provides a technical analysis using Elliott Wave, trading leve...

Read More >

Buy 1 Month

Get 3 Months!

Special Offer:

Trade Recommendations

Unleash the power of deversified trading with our comprehensive portfolio, covering:

  • Stock Trades
  • Crypto Trades
  • Forex Trades
  • Commodity Trades
Elliott Wave Analysis

Gain a competive edge with expert insights in to:

  • Global Indices
  • US Stocks & ASX Stocks
  • Forex & Crypto
  • Commodities
Top-Notch Trading Tools

Equip yourself with the tools of success:

  • Social Chat
  • Elliott Wave Algorithm
  • Screener
  • TradingLevels
  • Trading Game
7 Elliott Wave Analysts

Stay ahead of the market with daily charts and insightful videos
-Your secret to strategic trading!

JOIN HERE


Welcome to TradingLounge (ASIC A.R.No. 321187), specialists in trades, trading education and technical analysis, covering stocks, indices, commodities, forex and cryptocurrencies.

When you join TradingLounge you have access to everything we offer, including trade tools, educational content and a social platform to chat with like-minded investors.

Read more

@Copyright 2024 by tradinglounge.com

Contact Us

Australian no: 02 4787 6020

International no: +61 (2) 47876020

Pay with:

Find us on