EURGBP Elliott Wave Analysis Trading Lounge Day Chart,
Euro/British Pound(EURGBP) Day Chart Analysis
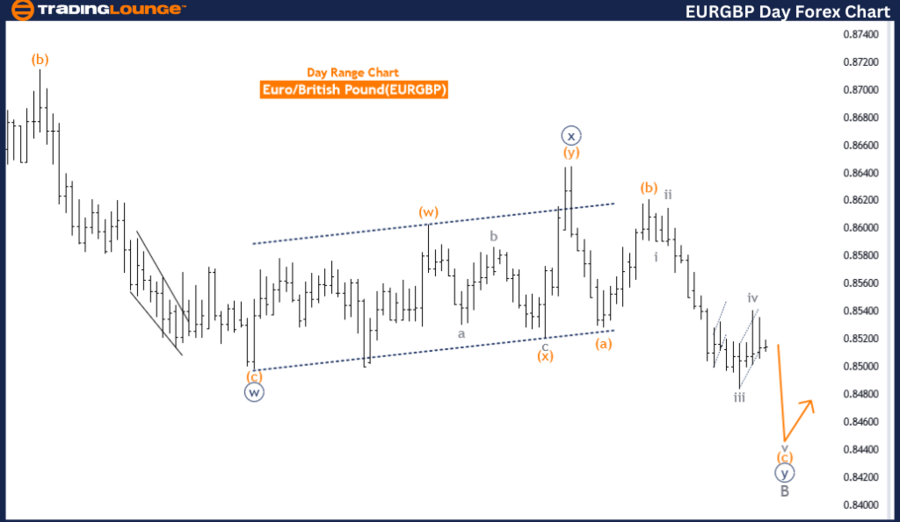
EURGBP Elliott Wave Technical Analysis
FUNCTION: Counter Trend
MODE: impulsive
STRUCTURE: orange wave C
POSITION: Navy Blue Wave Y
DIRECTION NEXT HIGHER DEGREES: new uptrend
DETAILS: orange wave B of navy blue wave Y looking completed, now orange wave C is in play.
The EURGBP Elliott Wave Analysis for the day chart provides an in-depth look into the current market conditions using Elliott Wave Theory. The analysis identifies the market function as a counter trend, which indicates a reversal or correction within the broader market trend. The mode of the wave structure is impulsive, signifying strong directional movements typical of a significant phase in the Elliott Wave sequence.
The primary wave structure under consideration is orange wave C, which is part of a larger navy blue wave Y. The current position within this structure is the completion of orange wave B of navy blue wave Y, suggesting that the market has finished a corrective phase and is now moving into the next phase, which is orange wave C.
The direction for the next higher degrees points to a new uptrend, indicating that after the completion of the current corrective waves, the market is expected to resume an upward trajectory. This sets the stage for a potential bullish market once the corrective phases are fully completed.
The details of the analysis indicate that orange wave B of navy blue wave Y appears to be completed. This completion signifies that the market has likely finished a significant corrective move, and the focus is now on orange wave C, which is in play. Orange wave C represents the next phase of the corrective sequence and is expected to show impulsive characteristics, driving the market in a new direction.
In summary, the EURGBP Elliott Wave Analysis on the day chart outlines a counter-trend within an impulsive mode, specifically focusing on orange wave C of navy blue wave Y. With orange wave B considered complete, the market is now progressing through orange wave C. This analysis suggests a shift towards a new uptrend in the higher degree waves, indicating potential bullish movements in the near future. This detailed wave analysis provides traders with valuable insights into the expected market movements and the completion of key wave structures.
EURGBP Elliott Wave Analysis Trading Lounge 4-Hour Chart,
Euro/British Pound(EURGBP) 4 Hour Chart Analysis
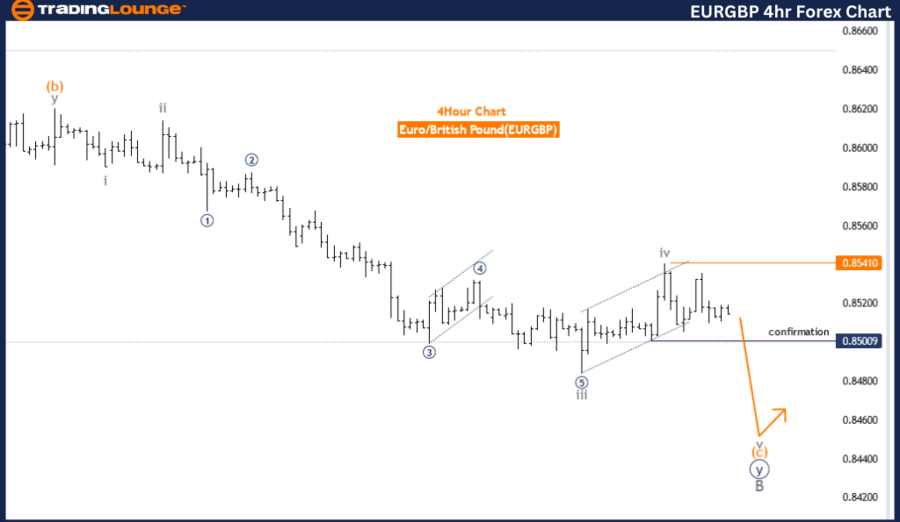
EURGBP Technical Analysis
FUNCTION: Counter Trend
MODE: impulsive
STRUCTURE: gray wave 5
POSITION: orange wave C
DIRECTION NEXT LOWER DEGREES: grey wave 5(started)
DETAILS: Gray wave 4 of C looking completed, now gray wave 5 of C is in play.
Wave Cancel invalid level: 0.85410
The EURGBP Elliott Wave Analysis for the 4-hour chart offers insights into the market's movements using Elliott Wave Theory. The analysis identifies the current trend as a counter-trend, indicating a potential reversal or correction within a broader trend. The mode of the wave structure is impulsive, suggesting strong movements in one direction, typically indicative of a significant phase within the Elliott Wave sequence.
The primary wave structure being analyzed is gray wave 5, which is currently in play. This wave is part of the larger orange wave C, positioning gray wave 5 as the final wave within the corrective sequence of orange wave C. The analysis suggests that gray wave 4 of C has likely been completed, and the market is now progressing through gray wave 5 of C.
The direction for the next lower degrees points to gray wave 5, which has started. This implies that the market is in the midst of an impulsive wave that should continue until gray wave 5 completes. The anticipated movement within gray wave 5 suggests ongoing activity in this phase, likely characterized by strong and directional market actions.
A crucial aspect of the analysis is the wave cancel invalid level, set at 0.85410. This level serves as a critical threshold for maintaining the validity of the current wave count. If the market drops below this level, it would invalidate the current wave structure, requiring a reassessment of the wave analysis. Hence, staying above this level is essential for the continuation of the identified wave patterns.
In summary, the EURGBP Elliott Wave Analysis on the 4-hour chart outlines a counter-trend in an impulsive mode, with gray wave 5 of orange wave C currently in play. The completion of gray wave 4 sets the stage for the ongoing progression of gray wave 5. The analysis highlights a wave cancel invalid level at 0.85410, which is crucial for validating the current wave count. This analysis provides traders with a detailed understanding of the potential movements and critical thresholds within the EURGBP market.
Technical Analyst: Malik Awais
Source: visit Tradinglounge.com and learn From the Experts Join TradingLounge Here
Previous: AUDUSD Elliott Wave Technical Analysis
Special Trial Offer - 0.76 Cents a Day for 3 Months! Click here
Access 7 Analysts Over 170 Markets Covered. Chat Room With Support