AUDUSD Elliott Wave Analysis - Trading Lounge Day Chart
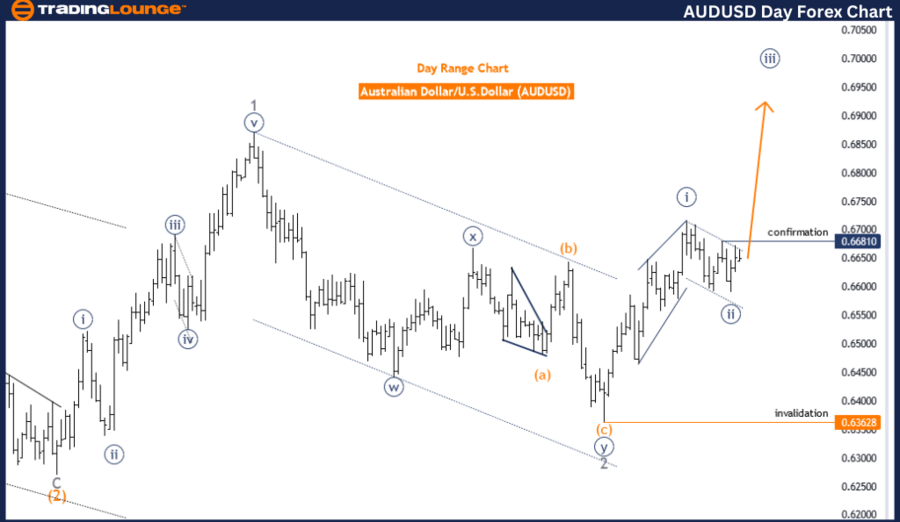
Australian Dollar/U.S. Dollar Day Chart Analysis
AUDUSD Elliott Wave Technical Analysis
- FUNCTION: Trend
- MODE: Impulsive
- STRUCTURE: Navy Blue Wave 3
- POSITION: Gray Wave 3
- DIRECTION NEXT HIGHER DEGREES: Navy Blue Wave 3 (started)
- DETAILS: Navy Blue Wave 2 appears completed at 0.65919. Now, Navy Blue Wave 3 is in play.
- Wave Cancel Invalid Level: 0.63628
The AUDUSD Elliott Wave Analysis for the day chart focuses on the market's current trend using the Elliott Wave Theory. This analysis identifies and predicts movements in the Australian Dollar against the U.S. Dollar. The market trend is characterized as impulsive, indicating a strong and sustained movement in one direction.
The specific wave structure under analysis is Navy Blue Wave 3, positioned within Gray Wave 3. This indicates the market is experiencing an upward trend within a larger wave sequence. The completion of Navy Blue Wave 2 has been observed at the level of 0.65919, signaling the end of a corrective phase and the beginning of Navy Blue Wave 3. This phase is expected to continue the strong upward movement, suggesting further bullish momentum in the market.
The direction for the next higher degrees points towards Navy Blue Wave 3, which has just started. This implies that the market is anticipated to maintain its upward trend for a significant period, reflecting the robust nature of the impulsive wave structure currently in play.
A crucial detail in this analysis is the wave cancel invalid level set at 0.63628. This level acts as a critical threshold that, if breached, would invalidate the current wave count and necessitate a reassessment of the wave structure. It is vital for the market to stay above this level to preserve the validity of the current Elliott Wave count and for the expected trends to unfold as anticipated.
In summary, the AUDUSD Elliott Wave Analysis on the day chart highlights a strong, impulsive trend within Navy Blue Wave 3, following the completion of Navy Blue Wave 2 at 0.65919. The market is projected to continue its upward momentum, with the wave cancel invalid level at 0.63628 serving as a key point for maintaining the current wave count's validity. This analysis provides valuable insights for traders using Elliott Wave Theory to guide their strategic decisions.

AUDUSD Elliott Wave Analysis - Trading Lounge 4-Hour Chart
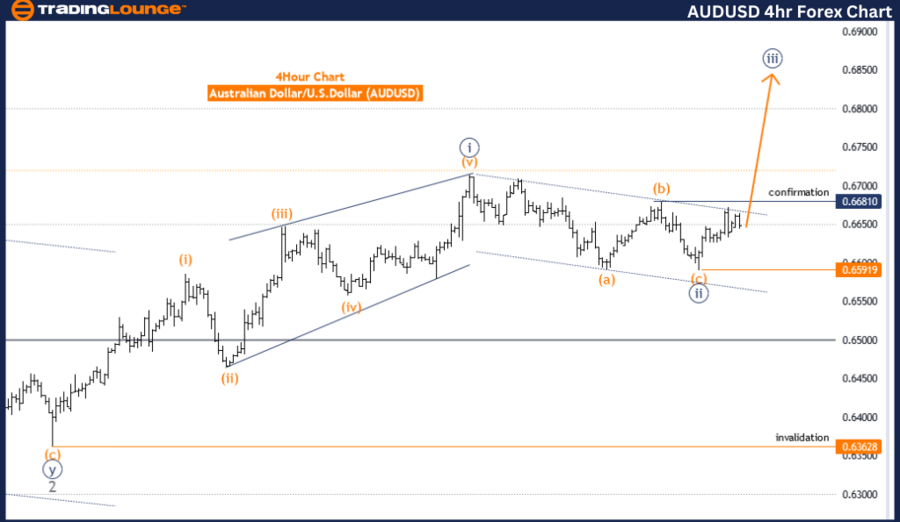
Australian Dollar/U.S. Dollar 4-Hour Chart Analysis
AUDUSD Elliott Wave Technical Analysis
- FUNCTION: Trend
- MODE: Impulsive
- STRUCTURE: Navy Blue Wave 3
- POSITION: Gray Wave 3
- DIRECTION NEXT HIGHER DEGREES: Navy Blue Wave 3 (started)
- DETAILS: Navy Blue Wave 2 appears completed at 0.65919. Now, Navy Blue Wave 3 is in play.
- Wave Cancel Invalid Level: 0.63628
The AUDUSD Elliott Wave Analysis for the 4-hour chart examines the market's current trend using the Elliott Wave Theory. This analysis focuses on identifying and predicting the movements of the Australian Dollar against the U.S. Dollar. The market trend is characterized as impulsive, indicating a strong and sustained movement in a single direction.
The specific wave structure under analysis is Navy Blue Wave 3, positioned within Gray Wave 3. This indicates the market is experiencing an upward trend within a larger wave sequence. The completion of Navy Blue Wave 2 has been observed at the level of 0.65919, signaling the end of a corrective phase and the beginning of Navy Blue Wave 3. This phase typically continues the strong upward movement, suggesting further bullish momentum in the market.
The direction for the next higher degrees points towards Navy Blue Wave 3, which has just started. This implies that the market is expected to maintain its upward trend for a significant period, reflecting the robust nature of the impulsive wave structure currently in play.
A crucial detail in this analysis is the wave cancel invalid level set at 0.63628. This level acts as a critical threshold that, if breached, would invalidate the current wave count and necessitate a reassessment of the wave structure. It is vital for the market to stay above this level to preserve the validity of the current Elliott Wave count and for the expected trends to unfold as anticipated.
In summary, the AUDUSD Elliott Wave Analysis on the 4-hour chart highlights a strong, impulsive trend within Navy Blue Wave 3, following the completion of Navy Blue Wave 2 at 0.65919. The market is projected to continue its upward momentum, with the wave cancel invalid level at 0.63628 serving as a key point for maintaining the current wave count's validity. This analysis provides valuable insights for traders using Elliott Wave Theory to guide their strategic decisions.
Technical Analyst: Malik Awais
Source: visit Tradinglounge.com and learn From the Experts Join TradingLounge Here
Previous: Euro/U.S. Dollar (EURUSD) Elliott Wave Technical Analysis
Special Trial Offer - 0.76 Cents a Day for 3 Months! Click here
Access 7 Analysts Over 170 Markets Covered. Chat Room With Support
