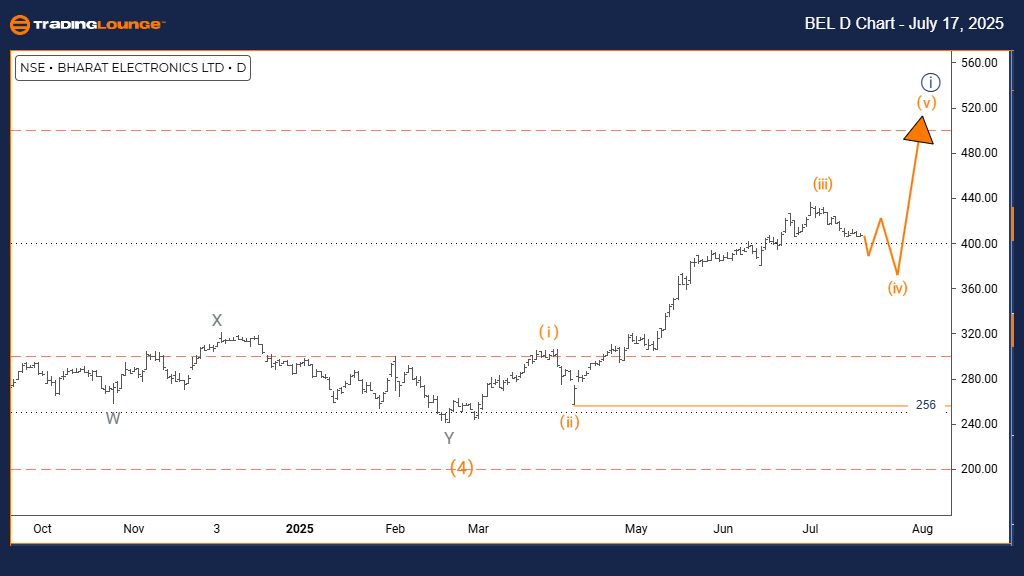
Bharat Electronics Elliott Wave Analysis – TradingLounge Day Chart
Bharat Electronics Day Chart Analysis
Bharat Electronics Elliott Wave Technical Review
FUNCTION: Counter-Trend
MODE: Corrective
STRUCTURE: Orange Wave 4
POSITION: Navy Blue Wave 1
DIRECTION NEXT HIGHER DEGREES: Orange Wave 5
DETAILS: Orange Wave 3 appears completed. Currently, Orange Wave 4 is active.
Invalidation Level: 256
The daily Elliott Wave analysis of BHARAT ELECTRONICS reflects a corrective phase within a broader trend, suggesting a counter-trend movement. The price action is forming Orange Wave 4, nested inside a larger Navy Blue Wave 1 framework, indicating a temporary pullback from the dominant bullish direction.
Technical assessments confirm that Orange Wave 3 has concluded, with Wave 4 now in progress. This phase typically represents a consolidation period before the next impulsive wave, Orange Wave 5, resumes the upward trend.
Corrective phases like Wave 4 often exhibit slower momentum and may involve sideways trading. After this consolidation, the next phase—Orange Wave 5—is expected to follow, continuing the primary uptrend. A key invalidation level at 256 acts as a risk control marker; a decline below this would nullify the current wave count.
This Elliott Wave structure helps traders monitor the end of the corrective move and anticipate the start of the next bullish leg. As Orange Wave 4 is part of Navy Blue Wave 1, it highlights a short-term retracement within a larger uptrend. Staying above the 256 support level aligns with the ongoing bullish projection.
Traders are advised to track the behavior of Orange Wave 4 for weakening momentum as a signal for a potential transition. This stage emphasizes the stock’s positioning between correction and trend continuation, delivering valuable insight for short-term strategies.
By using the Elliott Wave method, traders can more accurately time market entry points. The 256 level offers a critical reference for risk management, and the daily chart enhances visibility into short-term wave dynamics within the broader bullish cycle.
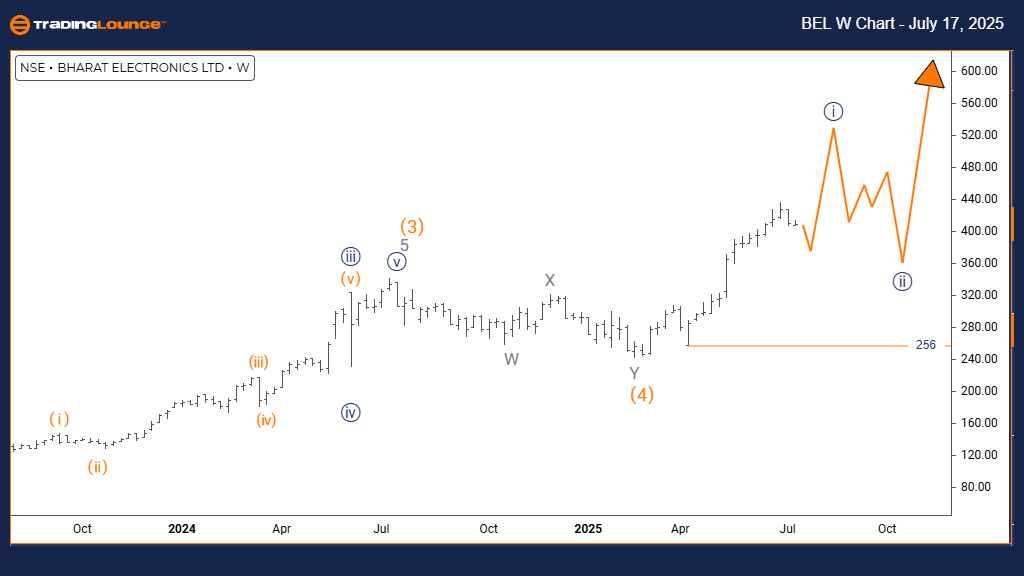
Bharat Electronics Elliott Wave Analysis – Trading Lounge Weekly Chart
Bharat Electronics Elliott Wave Technical Review
FUNCTION: Bullish Trend
MODE: Impulsive
STRUCTURE: Navy Blue Wave 1
POSITION: Gray Wave 1
DIRECTION NEXT LOWER DEGREES: Navy Blue Wave 2
DETAILS: Orange Wave 4 appears completed. Now, Navy Blue Wave 1 of 5 is unfolding.
The weekly Elliott Wave outlook for BHARAT ELECTRONICS signals a strong bullish trend, driven by impulsive price activity. The market is unfolding a Navy Blue Wave 1, embedded within a larger Gray Wave 1, marking the initial phase of a longer upward cycle.
Technical patterns show Orange Wave 4 has finalized, initiating Navy Blue Wave 1 of 5. This launch into a new impulsive phase reflects renewed bullish momentum and enhances the outlook for continued gains.
An impulsive Elliott structure is marked by higher highs and higher lows, affirming market strength. This current wave position indicates that BHARAT ELECTRONICS is breaking out of its corrective state, entering a robust advance. The structure within Gray Wave 1 sets a positive backdrop for further price movement.
This wave framework is instrumental in helping traders pinpoint the market’s position within the broader uptrend. It confirms early-stage bullish development, offering a potential foundation for long-term strategies. The weekly chart supports this view by showcasing sustained momentum and emerging bullish energy.
Wave characteristics suggest continuous buying interest, with possible minor pullbacks being opportunities for entry. The ongoing transition from Orange Wave 4 to Navy Blue Wave 1 is a strategic pivot that traders can leverage for positioning with the trend.
This analysis equips traders with clarity on the market's direction and the timing of future moves. Given the current wave setup, further bullish expansion appears probable as the impulsive sequence unfolds.
Technical Analyst: Malik Awais
Source: Visit Tradinglounge.com and learn from the Experts. Join TradingLounge Here
Previous: LARSEN & TOUBRO Elliott Wave Technical Analysis
VALUE Offer - $1 for 2 Weeks then $29 a month!Click here
Access 7 Analysts Over 200 Markets Covered. Chat Room With Support