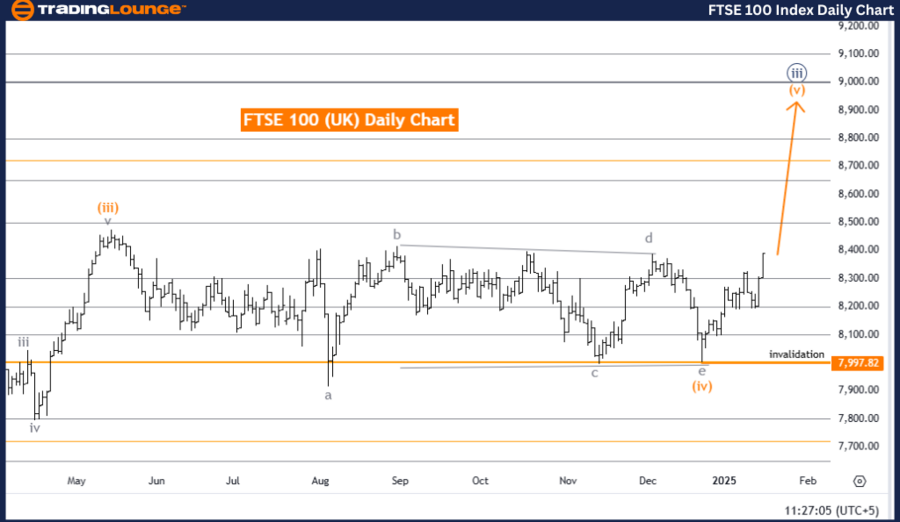
FTSE 100 (UK) Elliott Wave Analysis - Trading Lounge Day Chart
FTSE 100 (UK) Elliott Wave Technical Analysis
Function: Bullish Trend
Mode: Impulsive
Structure: Orange Wave 5
Position: Navy Blue Wave 3
Direction (Next Lower Degrees): Navy Blue Wave 4
Details
The daily analysis of the FTSE 100 index reveals a bullish trend based on Elliott Wave principles. The ongoing market action operates in an impulsive mode, highlighting orange wave five, which is driving the market higher. This wave is nested within the broader navy blue wave three, showcasing a firm continuation of the upward trend.
The corrective phase of orange wave four has likely concluded, signaling the start of orange wave five, which is expected to sustain the current upward movement. This aligns with the impulsive nature of navy blue wave three, reinforcing the strength of the bullish structure.
A critical invalidation level is established at 7,997.82. If the price dips below this level, the current wave structure will be invalidated, prompting a reassessment of the Elliott Wave count. However, as long as the price remains above this benchmark, the bullish trend remains intact, with further gains anticipated.
Conclusion
The FTSE 100 daily chart maintains a bullish outlook, with the market advancing within orange wave five after completing orange wave four. This progression within navy blue wave three confirms the impulsive phase of the trend. Monitoring the price level of 7,997.82 is essential to validate the bullish wave structure, with the market poised for continued upward momentum as long as this level holds.
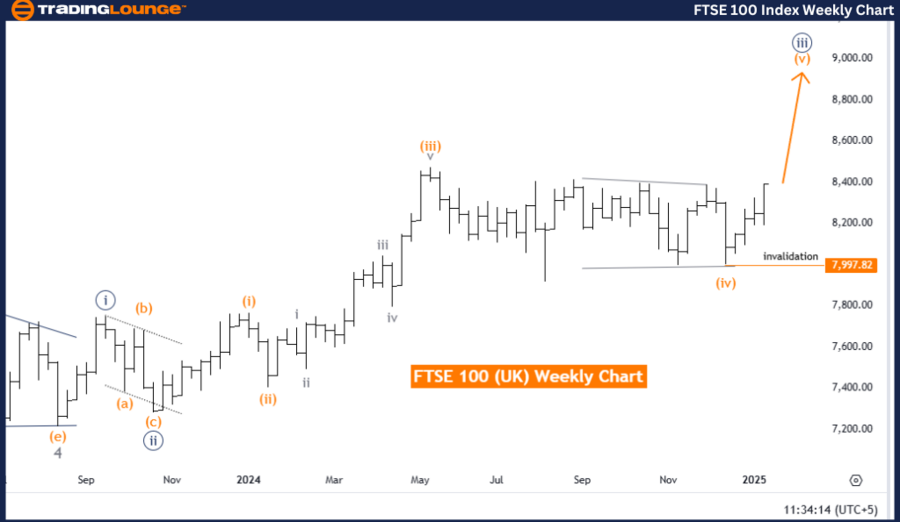
FTSE 100 (UK) Elliott Wave Analysis - Trading Lounge Weekly Chart
FTSE 100 (UK) Elliott Wave Technical Analysis
Function: Bullish Trend
Mode: Impulsive
Structure: Orange Wave 5
Position: Navy Blue Wave 3
Direction (Next Lower Degrees): Navy Blue Wave 4
Details
The weekly chart of the FTSE 100 index underscores a bullish trend, supported by Elliott Wave Analysis. The market continues to exhibit an impulsive mode, with orange wave five advancing within the larger framework of navy blue wave three. This structure underscores a strong upward trajectory, backed by persistent bullish momentum.
The corrective wave four of the orange degree appears to have ended, setting the stage for orange wave five to progress. This wave is expected to sustain the upward momentum within navy blue wave three, further reinforcing the bullish sentiment.
The invalidation level for this analysis is also marked at 7,997.82. A move below this point would nullify the current wave structure and necessitate a reevaluation. Until then, the bullish scenario remains valid, favoring further upward movement as the wave develops.
Summary
The FTSE 100 weekly chart projects a bullish perspective, with orange wave five actively unfolding after the conclusion of orange wave four. As part of navy blue wave three, this wave suggests a continuation of the upward trend with sustained market gains.
To maintain the integrity of the Elliott Wave pattern, the price must stay above the critical level of 7,997.82. This bullish wave structure indicates a robust market phase, primed for additional growth as long as the invalidation level is respected.
Technical Analyst: Malik Awais
Source: visit Tradinglounge.com and learn From the Experts Join TradingLounge Here
Previous: NIFTY 50 Elliott Wave Technical Analysis
VALUE Offer - Buy 1 Month & Get 3 Months!Click here
Access 7 Analysts Over 200 Markets Covered. Chat Room With Support