24Apr

AMCOR Stock Forecast: ASX AMC Starts Bullish Wave 3 After Corrective Zigzag – Elliott Wave Analysis, Price Targets, Trade Setups

AMCOR PLC (AMC) Elliott Wave Technical Analysis

ASX Stock Forecast, Elliott Wave Count & Trend Insights

Greetings,
Today’s Elliott Wave analysis for AMCOR PLC (ASX: AMC) highlights a key structural shift in price action. Our updated wave count suggests that AMC has completed a corrective phase—specifically a Double Zigzag pattern—marking the end of wave (2). This positions the stock at the start of a bullish third wave, setting the stage for a potential sustained rally. Below is our detailed technical breakdown.

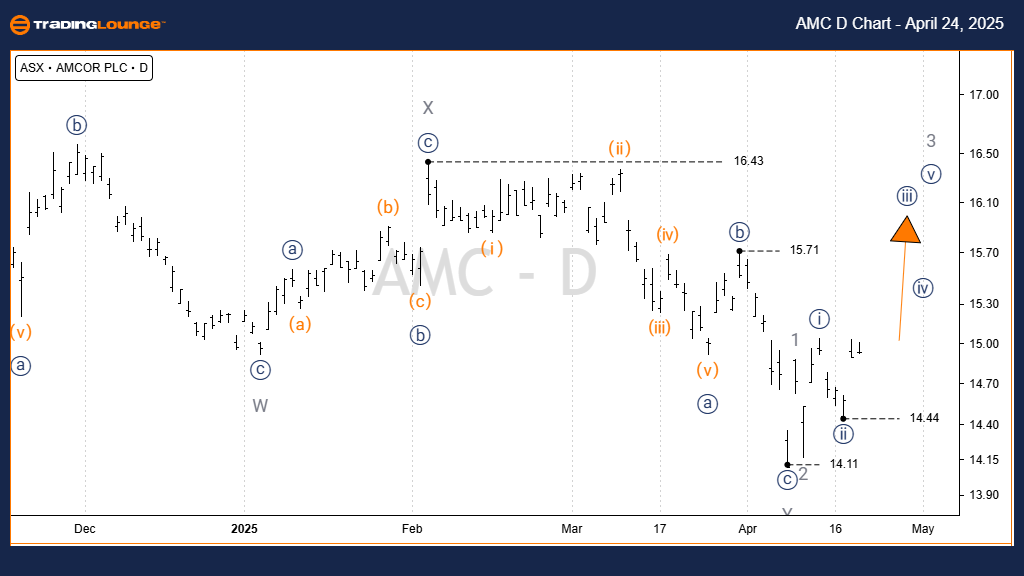
AMCOR PLC (AMC) Elliott Wave Analysis – TradingLounge 1D Chart

Technical Analysis Summary – 1D Chart (Semilog Scale)

Function: Major Trend (Intermediate Degree, Orange)

Mode: Motive

Structure: Impulse

Wave Position: Wave (3) – Orange

Elliott Wave Insights:

  • Wave (1) – Orange has already been completed.
  • Wave (2) – Orange finalised as a Double Zigzag (W-X-Y, Grey), marking the end of correction.
  • Wave (3) – Orange is now initiating, suggesting bullish momentum is gaining strength.

Key Invalidation Level: 14.11 AUD

AMCOR-PLC-asx-Day-Ch...


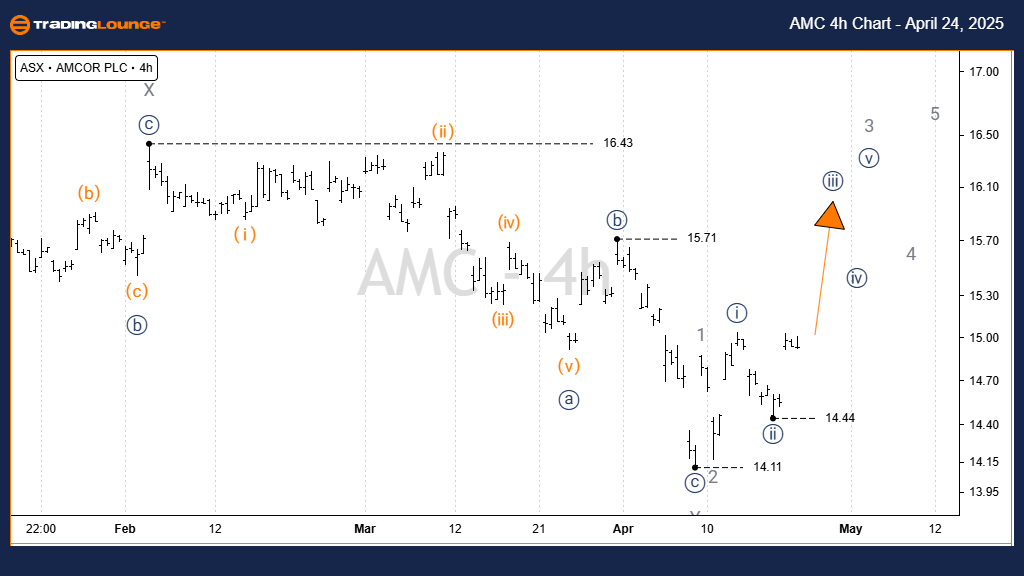
AMCOR PLC – AMC Elliott Wave Analysis – TradingLounge (4-Hour Chart)

4-Hour Chart Breakdown

Function: Major Trend (Minor Degree, Grey)

Mode: Motive

Structure: Impulse

Wave Position: Wave i)) – Navy of Wave 3 – Grey of Wave (3) – Orange

Detailed Outlook:

  • The Y – Grey wave of Wave (2) – Orange concluded as a Zigzag, confirming the end of the correction.
  • Post-14.11 AUD, upward structure unfolds through waves 1, 2, and 3 – Grey, confirming trend reversal.
  • Current development of Wave 3 – Grey is expanding through subwaves i)) to v)) – Navy, highlighting strong bullish momentum.

Key Invalidation Level: 14.44 AUD

Technical Analyst: Hua (Shane) Cuong, CEWA-M (Master’s Designation).

Source: Visit Tradinglounge.com and learn from the Experts. Join TradingLounge Here 

See Previous:  CAR GROUP LIMITED Elliott Wave Technical Analysis

VALUE Offer - Buy 1 Month & Get 3 Months!Click here

Access 7 Analysts Over 200 Markets Covered. Chat Room With Support

AMCOR-PLC-asx-4h-Cha...

Conclusion


This Elliott Wave analysis for AMCOR PLC (ASX: AMC) reveals a bullish setup following the completion of corrective wave structures. With wave (3) now in play, traders can anticipate potential upward price action. This technical outlook combines both long-term and short-term Elliott Wave forecasts, offering high-probability trade setups and precise validation levels.

Related

VeChain (VET) Elliott Wave Analysis Reveals Key Price Predictions and Strategic Trading Opportunities for Crypto Enthusiasts

VeChain (VET) Elliott Wave Analysis Reveals Key Price Predictions and Strategic Trading Opportunities for Crypto Enthusiasts

This article provides an in-depth Elliott Wave analysis of VeChain (VET), highlighting current marke...

Read More >
Silver XAGUSD Commodity Elliott Wave Technical Analysis: Covering various aspects of Silver Market

Silver XAGUSD Commodity Elliott Wave Technical Analysis: Covering various aspects of Silver Market

This detailed analysis provides an in-depth look at the silver market, employing Elliott Wave theory...

Read More >
NEE Elliott Wave Analysis: Explore NextEra Energy Stock Trends, Flat Structures, and Bullish Reversal Forecasts

NEE Elliott Wave Analysis: Explore NextEra Energy Stock Trends, Flat Structures, and Bullish Reversal Forecasts

Elliott Wave analysis of NextEra Energy (NEE) examines current stock trends, focusing on wave C corr...

Read More >
Tata Consultancy Services (TCS) Stock Analysis and TCS Elliott Wave Technical Analysis Provides upport and Resistance Levels

Tata Consultancy Services (TCS) Stock Analysis and TCS Elliott Wave Technical Analysis Provides upport and Resistance Levels

This detailed analysis of Tata Consultancy Services (TCS) explores key technical patterns using Elli...

Read More >
Global Indices Elliott Wave Update: DAX FTSE ASX Lead Rally as S&P 500 & NASDAQ 100 Enter Wave 5

Global Indices Elliott Wave Update: DAX FTSE ASX Lead Rally as S&P 500 & NASDAQ 100 Enter Wave 5

DAX 40, FTSE 100 and ASX 200 are leading global equities higher, while the S&P 500 and NASDAQ 100 su...

Read More >
Elliott Wave Analysis: Bearish and Bullish Scenarios for SP 500 and Nasdaq 100

Elliott Wave Analysis: Bearish and Bullish Scenarios for SP 500 and Nasdaq 100

The Elliott Wave analysis of the SP 500 and Nasdaq 100 indices suggests a predominant bearish trend ...

Read More >

$1 for 2 Weeks

then $29 a month!

What a Special Offer!

Trade Recommendations

Unleash the power of deversified trading with our comprehensive portfolio, covering 250+ markets:

  • Stock Trades
  • Crypto Trades
  • Forex Trades
  • Commodity Trades
Elliott Wave Analysis

Gain a competitive edge with expert insights and AI-powered Elliott Wave charting into:

  • Global Indices
  • US Stocks & ASX Stocks
  • Forex & Crypto
  • Commodities
Top-Notch Trading Tools

Equip yourself with the tools of success:

  • Real-time Chat rooms
  • Elliott Wave Algorithm
  • Portfolio tools
  • TradingLevels
  • Screener
  • Trading Game
7 Elliott Wave Analysts

Stay ahead of the market with daily charts and insightful videos
Your secret to strategic trading!

JOIN HERE


Welcome to TradingLounge (ASIC A.R.No. 321187), specialists in trades, trading education and technical analysis, covering stocks, indices, commodities, forex and cryptocurrencies.

When you join TradingLounge you have access to everything we offer, including trade tools, educational content and a social platform to chat with like-minded investors.

Read more

@Copyright 2024 by tradinglounge.com

Contact Us

Australian no: 02 4787 6020

International no: +61 (2) 47876020

Pay with:

Find us on