HDFC Bank Stock Analysis – HDFCBANK TradingLounge (1D Chart)
HDFCBANK Elliott Wave Technical Analysis
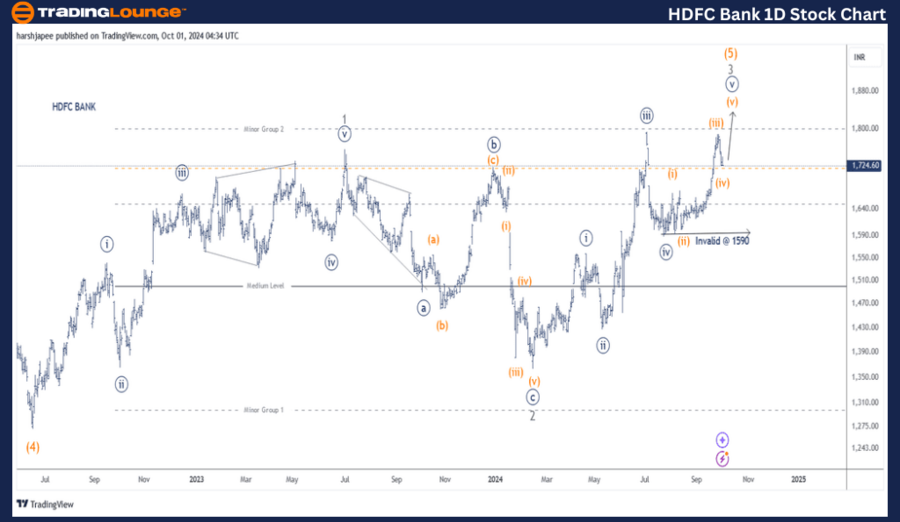
Function: Larger Degree Trend Higher (Intermediate degree, orange)
Mode: Motive
Structure: Impulse
Position: Minute Wave ((v)) Navy progressing higher
Details: Minute Wave ((v)) Navy is advancing within Minor Wave 3 Grey of Intermediate Wave (5) Orange, moving against the 1590 level. Additionally, Minuette Wave (v) Orange could soon resume its upward momentum.
Invalidation Point: 1590.
HDFC Bank Daily Chart Technical Analysis and Potential Elliott Wave Counts:
The HDFC Bank daily chart shows a strong rally, potentially unfolding Minor Wave 3 Grey within Intermediate Wave (5) Orange, advancing from the 1365 lows over the medium term. Minute Wave ((v)) may be unfolding now, or Minute Wave ((iii)) could extend, with the key level remaining at 1590.
In June 2022, HDFC Bank recorded a low near 1270, marking the end of Intermediate Wave (4) Orange. Minor Waves 1 and 2 Grey completed around the 1765 and 1265 levels, respectively. Since then, Minor Wave 3 Grey has been progressing, and prices are expected to stay above 1265.
We may adjust the degree of sub-waves within Minor Wave 3 depending on the evolving price action. There is a strong probability that Minute Wave ((iii)) will extend. The minimum target for Minute Wave ((v)) is a move above the 1970 mark for completion.
HDFC BANK – HDFCBANK Elliott Wave Technical Analysis (4H Chart)
Function: Larger Degree Trend Higher (Intermediate degree, orange)
Mode: Motive
Structure: Impulse
Position: Minute Wave ((v)) Navy progressing higher
Details: Minute Wave ((v)) Navy is advancing within Minor Wave 3 Grey of Intermediate Wave (5) Orange, moving against the 1590 level. Minuette Wave (v) Orange is expected to resume its upward movement within Minute Wave ((v)) Navy.
Invalidation Point: 1590.
HDFC Bank 4H Chart Technical Analysis and Potential Elliott Wave Counts:
The HDFC Bank 4-hour chart indicates that Minute Wave ((v)) Navy has been progressing since the 1590 lows. Minuette Waves (i) through (iv) Orange might have completed, with bulls expected to regain control near the 1710-1720 range. A push above 1800 could lead to an acceleration in upward momentum.
Technical Analyst: Harsh Japee
Source: visit Tradinglounge.com and learn From the Experts Join TradingLounge Here
Previous: BAJAJ FINANCE Elliott Wave Technical Analysis
VALUE Offer - Buy 1 Month & Get 3 Months!Click here
Access 7 Analysts Over 200 Markets Covered. Chat Room With Support
Conclusion:
HDFC Bank is advancing within Minute Wave ((v)) of Minor Wave 3 Grey as Intermediate Wave (5) Orange progresses towards the 1970-2000 range. A break below 1590, however, would shift the medium-term outlook.