TradingLounge Bajaj Finance – BAJFINANCE Elliott Wave Analysis (1D Chart)
BAJAJ FINANCE Stock Day Chart Technical Analysis
BAJFINANCE Elliott Wave Technical Analysis
Function: Counter Trend (Minor Degree, Grey)
Mode: Corrective
Structure: Potential Impulse of Larger Degree Correction
Position: Minor Wave 2 Grey
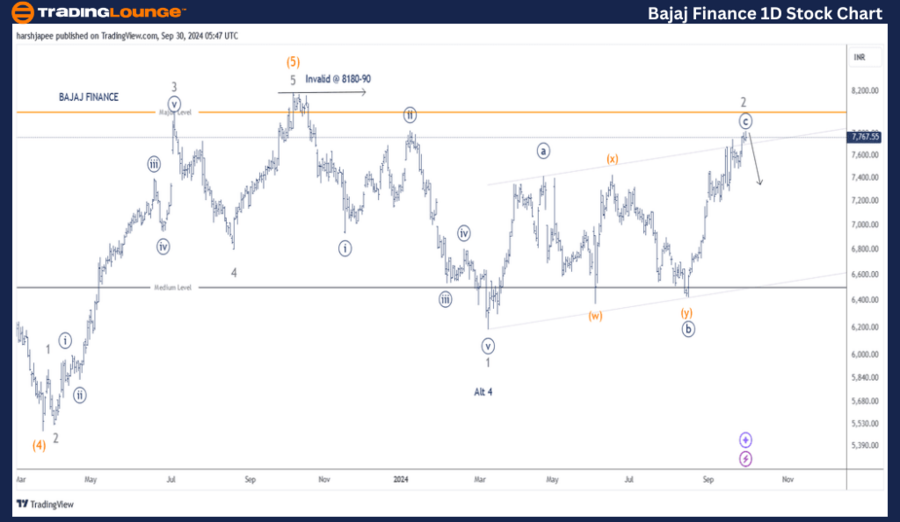
Details: Minor Wave 2 Grey has extended past the 7800 mark in the past week. A decline below 7100 will confirm that a top is in place. Long-term traders should consider taking profits now, while aggressive traders may prepare to enter short positions. There is a potential for the stock to turn lower from current levels, with resistance expected around 8180-8190. If the trend continues, Minor Wave 3 Grey could begin soon.
Invalidation Point: 8180-8190
BAJAJ Finance Technical Analysis and Potential Elliott Wave Counts:
The daily chart of BAJAJ Finance suggests that a potential Minor Degree Corrective Wave lower has been progressing since the stock hit the 8180-8190 high in October 2023. Alternatively, the stock may have completed Minor Wave 4 near the 6190 mark in March 2024, with Minor Wave 5 Grey unfolding since then.
The most likely Elliott Wave count indicates that Intermediate Wave (4) Orange concluded around the 5500 level in March 2023. Afterward, the stock surged past the 8180-8190 range, completing an impulse move and terminating Intermediate Wave (5) Orange by October 2023.
Since the October high, BAJAJ Finance appears to be forming a corrective Zigzag wave toward at least the 5500 level. Minor Waves 1 and 2 have developed around the 6200 and 7800-7850 ranges, respectively. If this count is accurate, prices should remain below 8190 and begin a downward move from here.
TradingLounge Bajaj Finance Elliott Wave Analysis (4H Chart)
BAJAJ FINANCE Elliott Wave Technical Analysis
Function: Counter Trend (Minor Degree, Grey)
Mode: Corrective
Structure: Potential Impulse of Larger Degree Correction
Position: Minor Wave 2 Grey
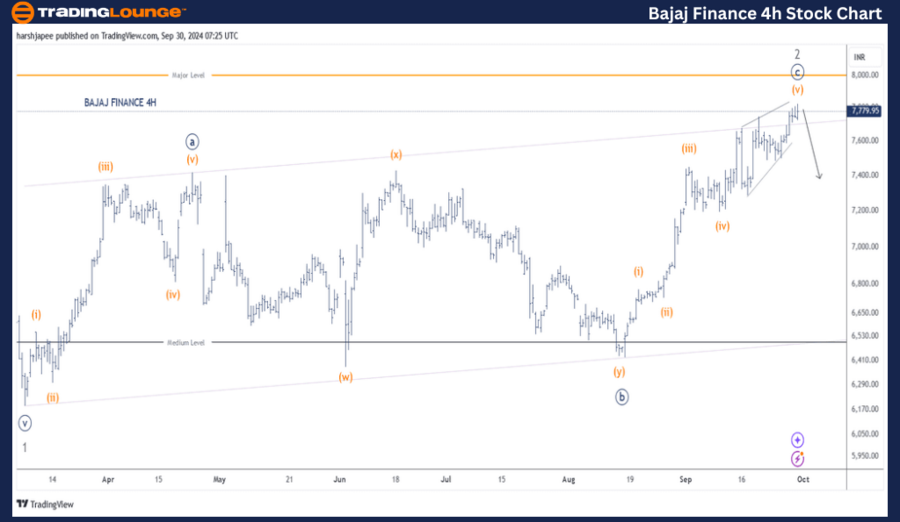
Details: Minor Wave 2 Grey extended beyond the 7800 level over the last week. A break below 7100 will confirm that the top is in place. Long traders are advised to take profits now, and aggressive traders can look for shorting opportunities. There is a likelihood that the stock will turn lower from current levels, with resistance expected near 8180-8190. Minor Wave 3 Grey could be developing soon. Additionally, the corrective Wave 2 Grey has tested its Elliott Channel resistance above the 7700-7750 range.
Invalidation Point: 8180-8190
BAJAJ Finance 4H Chart Technical Analysis and Potential Elliott Wave Counts:
The 4-hour chart of BAJAJ Finance highlights the sub-waves within Minor Wave 2 Grey, which seems to have completed near the 7850 mark. This structure appears to be a Zigzag pattern (5-3-5) represented by Minor Waves (a)-(b)-(c) between the 6200 and 7850 levels. If this is correct, Minor Wave 3 should begin shortly, with resistance set at 8190.
Technical Analyst: Harsh Japee
Source: visit Tradinglounge.com and learn From the Experts Join TradingLounge Here
Previous: CIPLA Elliott Wave Technical Analysis
VALUE Offer - Buy 1 Month & Get 3 Months!Click here
Access 7 Analysts Over 200 Markets Covered. Chat Room With Support
Conclusion:
BAJAJ Finance is currently progressing within a larger degree corrective wave, with resistance against the 8190 mark. Traders should monitor price action closely for confirmation of the next wave move.