The Boeing Company (BA) – Comprehensive Elliott Wave Forecast
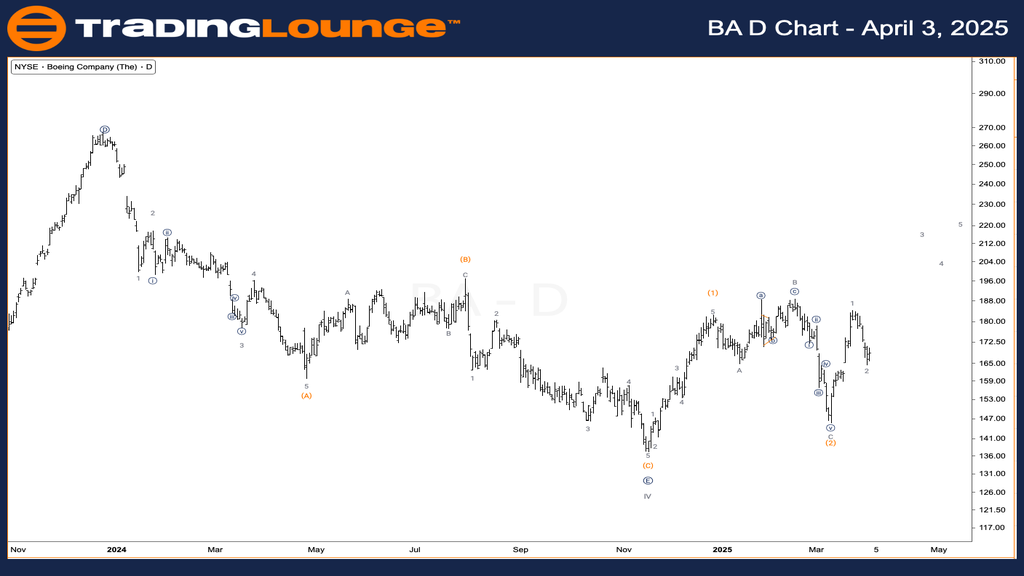
The Boeing Company BA Daily Chart Analysis
The Boeing Company BA Elliott Wave Technical Analysis
Function: Trend
Mode: Impulsive
Structure: Motive
Position: Wave 1 of (3)
Direction: Bullish trend toward wave 3
Details: The Elliott Wave structure for Boeing (BA) suggests a developing (1)-(2) or (A)-(B) formation. We anticipate a reversal from the wave 2 bottom, targeting a breakout above the key resistance zone at $200 and beyond, aligning with TradingLevel2 projections.

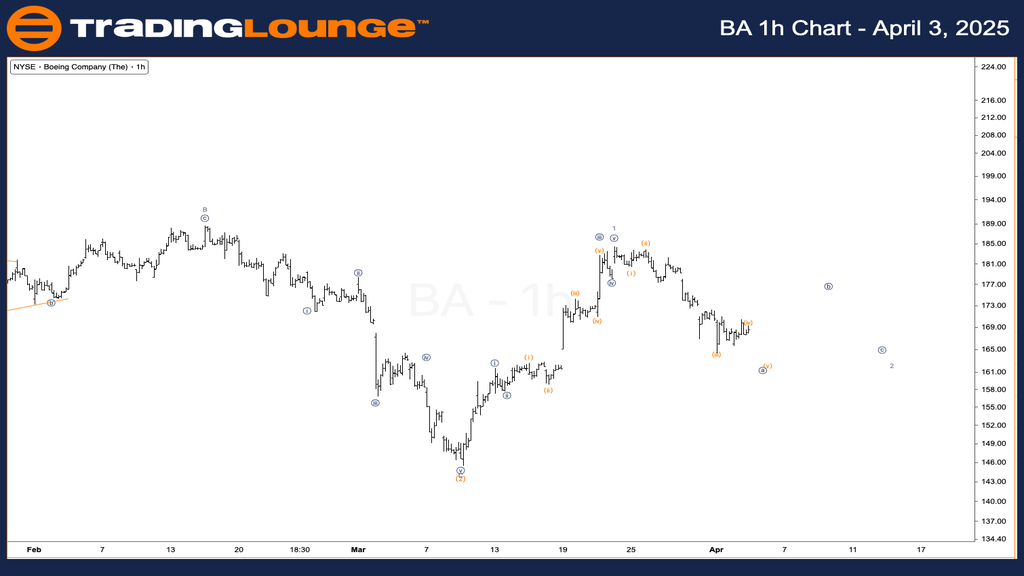
The Boeing Company (BA) 1-Hour Chart Analysis
Function: Trend
Mode: Impulsive
Structure: Motive
Position: Wave {a} of 2
Direction: Downward correction before bullish continuation
Details: The short-term Elliott Wave count for Boeing indicates that wave {a} of 2 is nearly complete. We foresee a brief continuation lower into wave {b}, followed by wave {c} to finalize wave 2. Watch for bullish reversal signals thereafter, signaling a potential shift into a sustained uptrend aligned with the higher degree wave 3.
Technical Analyst: Alessio Barretta
Source: Visit Tradinglounge.com and learn from the Experts. Join TradingLounge Here
Previous: Chevron Inc. (CVX) Elliott Wave Technical Analysis
VALUE Offer - Buy 1 Month & Get 3 Months!Click here
Access 7 Analysts Over 200 Markets Covered. Chat Room With Support
