16Apr

VeChain Crypto Price News Today - Elliott Wave Technical Analysis

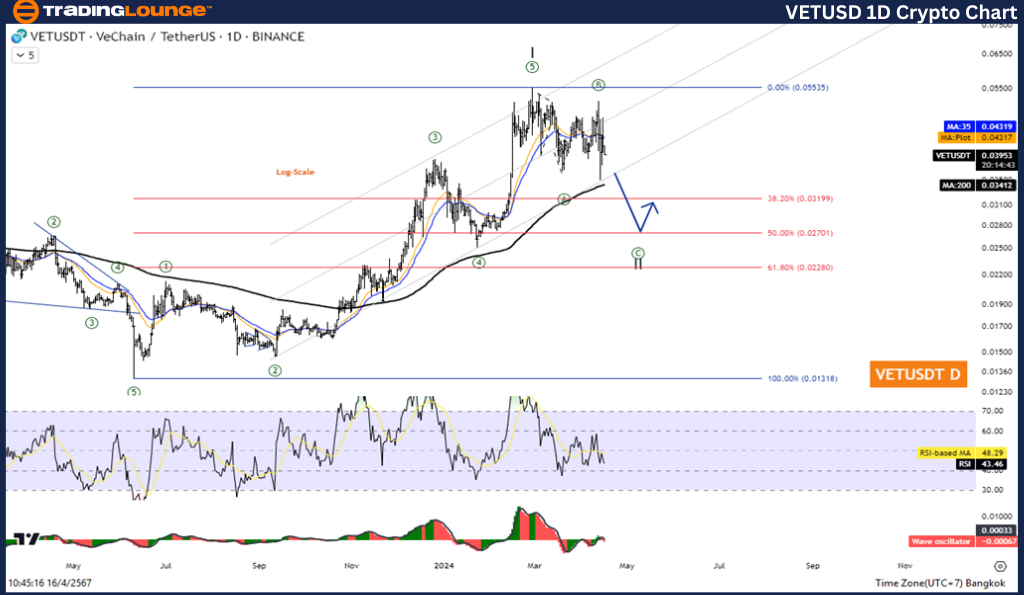
Elliott Wave Analysis TradingLounge Daily Chart

In both the daily and 4-hour charts of VeChain/USD (VETUSD), Elliott Wave analysis indicates a corrective phase within a flat structure. Identified as Wave ((C)), the current position suggests a countertrend move, potentially forming Wave II of a larger impulse wave.

VeChain/USD (VETUSD) Elliott Wave Technical Analysis

Function: Counter trend
Mode: Corrective
Structure: Flat
Position: Wave ((C))
Direction Next Higher Degrees: Wave II of Impulse
Wave Cancel Invalid Level: 0.2100
Details: Wave II equals 50% of Wave I at 0.0270

VeChain/USD (VETUSD) Trading Strategy:

The short-term retracement of the second wave is likely to retest the 50% level of the first wave at 0.0270. We anticipate further downside movement, albeit as a pullback in the short term. Await completion of the correction to rejoin the uptrend.

VeChain/USD (VETUSD) Technical Indicators:

The price remains above the MA200, signaling a downtrend. The Wave Oscillator exhibits bearish momentum.

VETUSD-1D-crypto-cha...


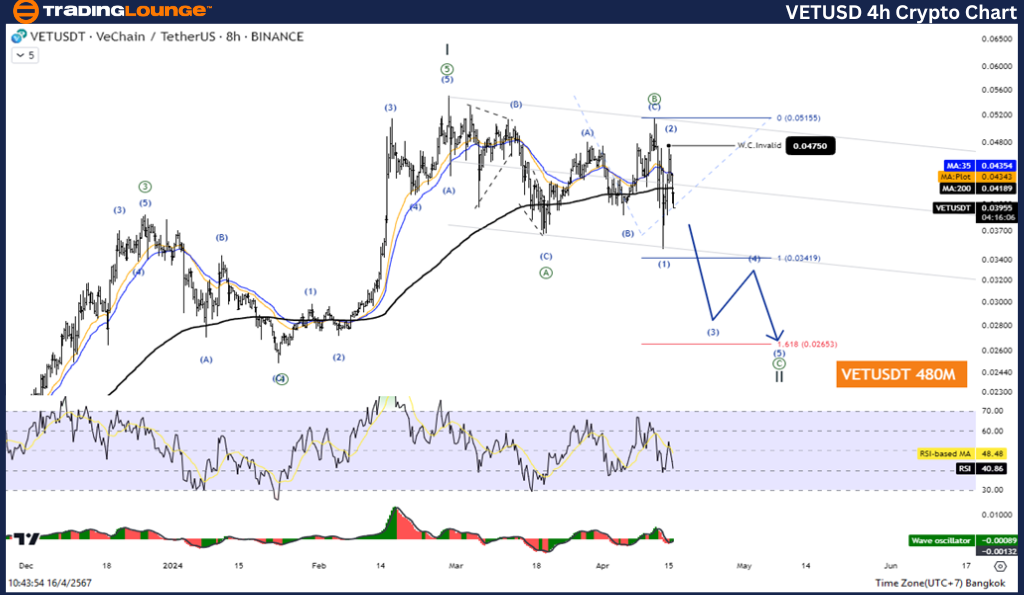
Elliott Wave Analysis TradingLounge 4H Chart

VeChain/USD (VETUSD) Elliott Wave Technical Analysis

Function: Counter trend
Mode: Corrective
Structure: Flat
Position: Wave ((C))
Direction Next Higher Degrees: Wave II of Impulse
Wave Cancel Invalid Level:
Details: Wave C equals 161.8% of Wave A at 0.0265

VeChain/USD (VETUSD) Trading Strategy:

The short-term retracement of the second wave is likely to retest the 50% level of the first wave at 0.0270. We expect further downward movement, albeit as a short-term pullback. Await completion of the correction to rejoin the uptrend.

VeChain/USD (VETUSD) Technical Indicators:

The price remains above the MA200, signaling a downtrend. The Wave Oscillator exhibits bearish momentum.

In conclusion, VeChain/USD (VETUSD) exhibits characteristics of a corrective phase within a flat structure. While short-term retracements are expected, the broader trend suggests an eventual continuation of the uptrend. Traders should exercise patience and await the completion of corrections before considering re-entry into long positions, keeping a close eye on key support and resistance levels for confirmation of trend continuation.

Technical Analyst: Kittiampon Somboonsod

Source: visit Tradinglounge.com and learn From the Experts Join TradingLounge Here 

See Previous: XRP/ U.S. dollar(XRPUSD)

TradingLounge Once Off SPECIAL DEAL: Here > 1 month Get 3 months.

TradingLounge's Free Week Extravaganza!

April 14 – 21: Unlock the Doors to Trading Excellence — Absolutely FREE

VETUSD-4Hr-crypto-ch...

Related

Newmont Corporation Elliott Wave Forecast: ASX:NEM Price Target $100 in Bullish Wave 3 With Key Invalidation at $74.25

Newmont Corporation Elliott Wave Forecast: ASX:NEM Price Target $100 in Bullish Wave 3 With Key Invalidation at $74.25

This Elliott Wave analysis of ASX: NEM (Newmont Corporation) outlines bullish wave structure, key le...

Read More >
Ethereum Crypto Price News Today - ETHUSD Elliott Wave Technical Analysis Signals Bullish Continuation

Ethereum Crypto Price News Today - ETHUSD Elliott Wave Technical Analysis Signals Bullish Continuation

Today's Ethereum price analysis, based on Elliott Wave Technical Analysis, indicates a bullish c...

Read More >
GBPUSD Bullish Trend: Elliott Wave Technical Analysis & Expert Forex Trading Strategies

GBPUSD Bullish Trend: Elliott Wave Technical Analysis & Expert Forex Trading Strategies

Get detailed insights into the GBPUSD market with this Elliott Wave analysis, focusing on the curren...

Read More >
DAX (Germany) Index Wave Technical Analysis: Highlights Key Support at 18530 Amid Strong Upward Market Momentum

DAX (Germany) Index Wave Technical Analysis: Highlights Key Support at 18530 Amid Strong Upward Market Momentum

The DAX index is exhibiting a bullish impulsive Wave 3, suggesting strong upward momentum. Key suppo...

Read More >
Navigating the Waves: Dogecoin Crypto Price News Today and DOGEUSD Elliott Wave Technical Analysis

Navigating the Waves: Dogecoin Crypto Price News Today and DOGEUSD Elliott Wave Technical Analysis

This article provides a detailed Elliott Wave analysis of the Dogecoin/U.S. dollar (DOGEUSD) pair, o...

Read More >
Polkadot DOTUSD Elliott Wave Analysis Predicts Wave III Bullish Breakout After ABC Correction and Fibonacci Level Confirmation

Polkadot DOTUSD Elliott Wave Analysis Predicts Wave III Bullish Breakout After ABC Correction and Fibonacci Level Confirmation

Polkadot (DOTUSD) may have completed wave II at 3.737 near the 0.618 Fibonacci level. A confirmed br...

Read More >

$1 for 2 Weeks

then $29 a month!

What a Special Offer!

Trade Recommendations

Unleash the power of deversified trading with our comprehensive portfolio, covering 250+ markets:

  • Stock Trades
  • Crypto Trades
  • Forex Trades
  • Commodity Trades
Elliott Wave Analysis

Gain a competitive edge with expert insights and AI-powered Elliott Wave charting into:

  • Global Indices
  • US Stocks & ASX Stocks
  • Forex & Crypto
  • Commodities
Top-Notch Trading Tools

Equip yourself with the tools of success:

  • Real-time Chat rooms
  • Elliott Wave Algorithm
  • Portfolio tools
  • TradingLevels
  • Screener
  • Trading Game
7 Elliott Wave Analysts

Stay ahead of the market with daily charts and insightful videos
Your secret to strategic trading!

JOIN HERE


Welcome to TradingLounge (ASIC A.R.No. 321187), specialists in trades, trading education and technical analysis, covering stocks, indices, commodities, forex and cryptocurrencies.

When you join TradingLounge you have access to everything we offer, including trade tools, educational content and a social platform to chat with like-minded investors.

Read more

@Copyright 2024 by tradinglounge.com

Contact Us

Australian no: 02 4787 6020

International no: +61 (2) 47876020

Pay with:

Find us on