Netflix Inc. (NFLX) – Elliott Wave Analysis & Forecast
This Elliott Wave analysis examines Netflix Inc. (NFLX) on both daily and 1-hour timeframes to assess the current wave structure and potential price trajectory.
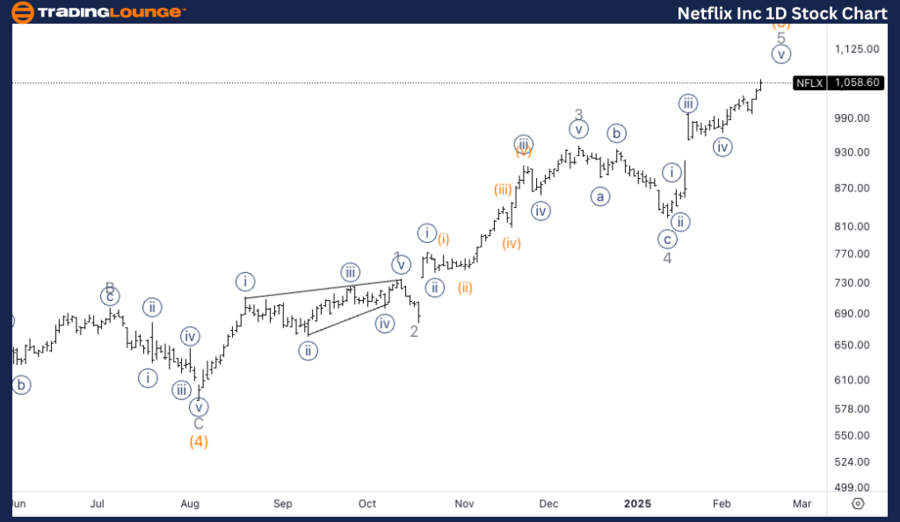
Netflix Inc. (NFLX) Daily Chart Analysis
NFLX Elliott Wave Technical Analysis
Function: Trend
Mode: Impulsive
Structure: Motive
Position: Wave {v} of 5
Direction: Bullish Continuation in Wave 5
Key Insights & Market Outlook:
- Netflix stock is expected to continue its bullish rally beyond the $1000 price level (TradingLevel1).
- No significant resistance has been observed after crossing this milestone, reinforcing strong upward momentum.
- If wave {v} completes, a temporary retracement to $1000 could occur before resuming the larger uptrend.
Daily Chart Summary:
Netflix Inc. (NFLX) is currently in wave {v} of 5, displaying a strong impulsive bullish structure.
- Breakout past $1000 confirms continued market strength.
- Potential short-term pullback to $1000 could materialize before further gains.
- Overall outlook: Further upside potential remains dominant.
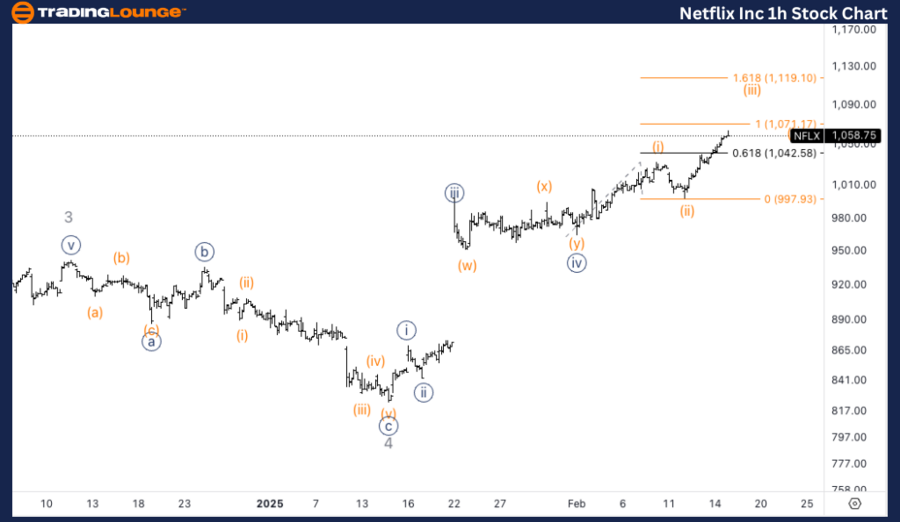
Netflix Inc. (NFLX) 1-Hour Chart Analysis
NFLX Elliott Wave Technical Analysis
Function: Trend
Mode: Impulsive
Structure: Motive
Position: Wave (iii) of {v}
Direction: Upward extension in wave {v}
Key Insights & Short-Term Forecast:
- Netflix stock is extending within wave (iii) of {v}, signaling additional upside momentum.
- Next bullish target: $1200, which aligns with the ongoing market rally.
1-Hour Chart Summary:
- NFLX is gaining strength in wave (iii) of {v}, confirming further price appreciation.
- The short-term target remains $1200, supported by strong market sentiment and Elliott Wave projections.
- Bullish continuation is expected before wave {v} concludes.
Technical Analyst: Alessio Barretta
Source: visit Tradinglounge.com and learn From the Experts Join TradingLounge Here
See Previous: CSX Corp. (CSX) Elliott Wave Technical Analysis
VALUE Offer - Buy 1 Month & Get 3 Months!Click here
Access 7 Analysts Over 200 Markets Covered. Chat Room With Support
Conclusion:
Netflix Inc. (NFLX) maintains a strong Elliott Wave structure, with bullish momentum intact across both daily and 1-hour timeframes. The next resistance target is $1200, while a minor pullback to $1000 remains possible before further gains. Investors should monitor wave {v} closely for potential trend continuation or corrective movements.