24Feb

Insurance Australia Group Limited Trading Strategy & Market Trends: IAG Stock Analysis & Elliott Wave Technical Forecast

ASX: INSURANCE AUSTRALIA GROUP LIMITED (IAG) Elliott Wave Technical Analysis – TradingLounge

Overview​​​​​​, Our latest Elliott Wave analysis for INSURANCE AUSTRALIA GROUP LIMITED (ASX: IAG) provides an updated perspective on market movements, emphasizing its corrective phase.

We identify that ASX: IAG shares continue within a corrective wave, signaling the need for further downside before a potential bullish reversal.


ASX: INSURANCE AUSTRALIA GROUP LIMITED (IAG) Elliott Wave Analysis

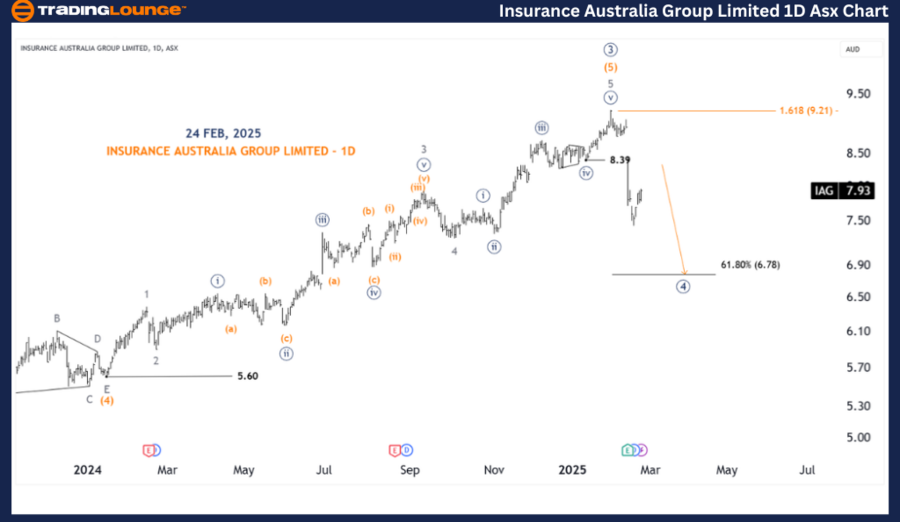
INSURANCE AUSTRALIA GROUP LIMITED 1D Chart (Semilog Scale) Analysis

Function: Major Trend (Primary degree, navy)

Mode: Motive

Structure: Impulse

Position: Wave ((4)) - navy

Details:

  • Wave ((3)) - navy concluded as a five-wave impulse, labeled from (1) - orange to (5) - orange.
  • Wave ((4)) - navy is in progress, likely pushing lower toward 6.78 USD before stabilizing.
  • A bullish breakout for Wave (5) - orange is not anticipated. Instead, market structure suggests that Wave ((4)) - navy has started an ABC Zigzag correction.

Invalidation Point: The end of Wave ((3)) - navy.

Insurance-Australia-...


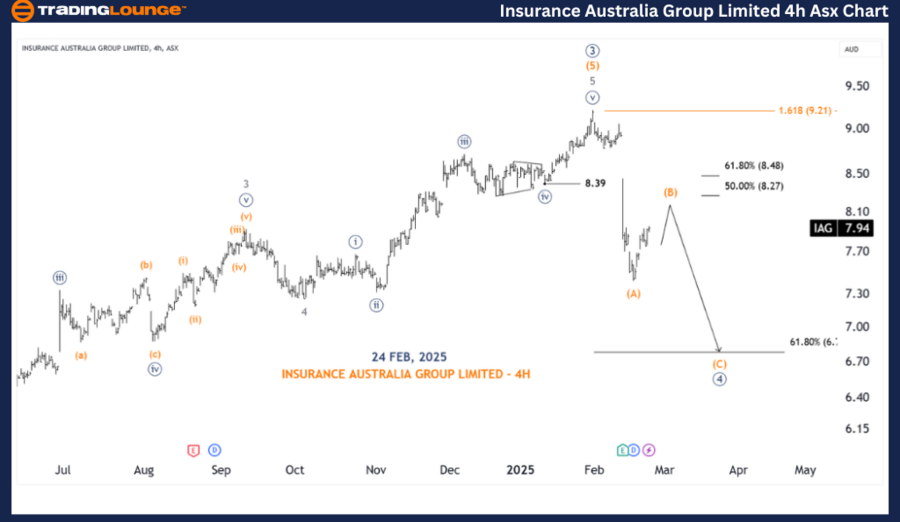
ASX: INSURANCE AUSTRALIA GROUP LIMITED – TradingLounge (4-Hour Chart)

IAG Elliott Wave Technical Analysis

ASX: IAG 4-Hour Chart Analysis

Function: Major Trend (Minute degree, navy)

Mode: Motive

Structure: Impulse

Position: Wave (B) - orange of Wave ((4)) - navy

Details:

  • Wave ((4)) - navy remains in a downward corrective phase.
  • The formation exhibits an (A)-(B)-(C) - orange pattern.
  • Wave (B) - orange is nearing completion, with expectations for a downward move in Wave (C) - orange.

Invalidation Point: 15.06 USD

Key Point: The end of Wave ((3)) - navy serves as a critical reference for this structure.

Technical Analyst: Hua (Shane) Cuong, CEWA-M (Master’s Designation).

Source: visit Tradinglounge.com and learn From the Experts Join TradingLounge Here 

See Previous: JAMES HARDIE INDUSTRIES PLC Elliott Wave Technical Analysis

VALUE Offer - Buy 1 Month & Get 3 Months!Click here

Access 7 Analysts Over 200 Markets Covered. Chat Room With Support

Insurance-Australia-...


Conclusion

Our Elliott Wave analysis provides key market insights for ASX: IAG, allowing traders to make informed decisions based on trend confirmation and price validation levels.

Identifying key price levels for validation and invalidation improves forecast accuracy, offering an objective approach to analyzing market trends. By applying Elliott Wave Theory, traders can navigate short-term corrections and anticipate price movement scenarios effectively.

Related

Technical Analysis of Adani Green Energy Stock with Elliott Wave Insights: Understand Share Price and Trends Movements

Technical Analysis of Adani Green Energy Stock with Elliott Wave Insights: Understand Share Price and Trends Movements

Dive into the technical analysis of Adani Green Energy stock with Elliott Wave insights. Understand ...

Read More >
Discover the stock's Price Predictions, Technical Indicators, and Expected Market Movements: JSW Steel Elliott Wave Analysis

Discover the stock's Price Predictions, Technical Indicators, and Expected Market Movements: JSW Steel Elliott Wave Analysis

This article provides an in-depth Elliott Wave analysis of JSW Steel, highlighting potential stock p...

Read More >
Daily & Weekly CAC 40 Elliott Wave Analysis: Corrective Counter‑Trend and Bullish Impulse Gray Wave 3, Watch Invalidation Level

Daily & Weekly CAC 40 Elliott Wave Analysis: Corrective Counter‑Trend and Bullish Impulse Gray Wave 3, Watch Invalidation Level

This detailed CAC 40 Elliott Wave analysis explains the current daily corrective Orange Wave 2 insi...

Read More >
NIKKEI 225 Index Elliott Wave Technical Analysis: Understanding the Current Corrective Phase and Future Projections

NIKKEI 225 Index Elliott Wave Technical Analysis: Understanding the Current Corrective Phase and Future Projections

This article provides a detailed Elliott Wave analysis of the NIKKEI 225, examining the current corr...

Read More >
Euro/U.S.Dollar(EURUSD) Forex Elliott Wave Technical Analysis: Comprehensive Look at Trading Patterns

Euro/U.S.Dollar(EURUSD) Forex Elliott Wave Technical Analysis: Comprehensive Look at Trading Patterns

Our detailed EURUSD Elliott Wave analysis helps traders anticipate EURUSD movements by outlining key...

Read More >
Stay ahead of the Market with Our Expert XRP Chart Analysis and Price Predictions: XRPUSD Elliott Wave Technical Analysis

Stay ahead of the Market with Our Expert XRP Chart Analysis and Price Predictions: XRPUSD Elliott Wave Technical Analysis

Gain insights into XRP price movements with our in-depth Elliott Wave analysis. Discover trading str...

Read More >

$1 for 2 Weeks

then $29 a month!

What a Special Offer!

Trade Recommendations

Unleash the power of deversified trading with our comprehensive portfolio, covering 250+ markets:

  • Stock Trades
  • Crypto Trades
  • Forex Trades
  • Commodity Trades
Elliott Wave Analysis

Gain a competitive edge with expert insights and AI-powered Elliott Wave charting into:

  • Global Indices
  • US Stocks & ASX Stocks
  • Forex & Crypto
  • Commodities
Top-Notch Trading Tools

Equip yourself with the tools of success:

  • Real-time Chat rooms
  • Elliott Wave Algorithm
  • Portfolio tools
  • TradingLevels
  • Screener
  • Trading Game
7 Elliott Wave Analysts

Stay ahead of the market with daily charts and insightful videos
Your secret to strategic trading!

JOIN HERE


Welcome to TradingLounge (ASIC A.R.No. 321187), specialists in trades, trading education and technical analysis, covering stocks, indices, commodities, forex and cryptocurrencies.

When you join TradingLounge you have access to everything we offer, including trade tools, educational content and a social platform to chat with like-minded investors.

Read more

@Copyright 2024 by tradinglounge.com

Contact Us

Australian no: 02 4787 6020

International no: +61 (2) 47876020

Pay with:

Find us on