Welcome to our latest Elliott Wave analysis for Caterpillar Inc. (CAT). This analysis delves into CAT's price movements through the lens of the Elliott Wave Theory, aiming to uncover potential trading opportunities based on current trends and market structures. We will examine both the daily and 4-hour charts to provide a thorough perspective on CAT's market behaviour.

CAT Elliott Wave Analysis Trading Lounge Daily Chart

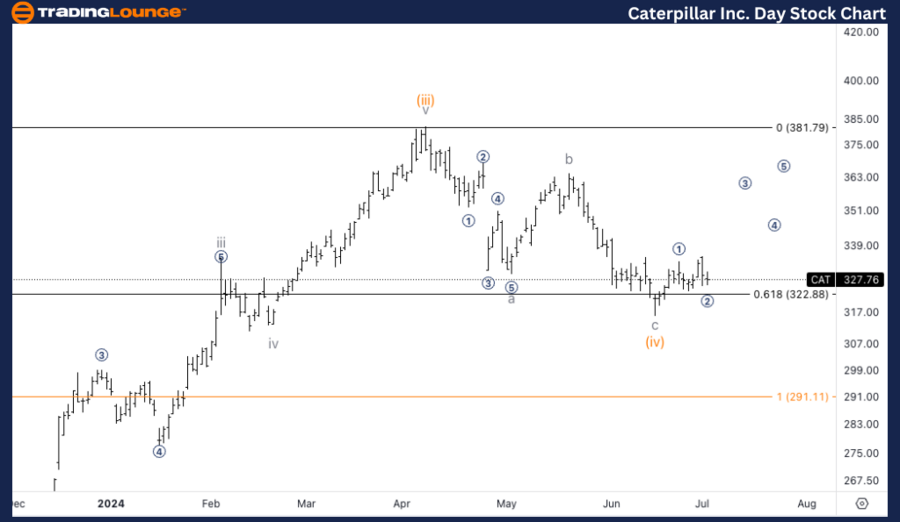
Caterpillar Inc., (CAT) Daily Chart Analysis

CAT Stock Analysis

FUNCTION: Trend

MODE: Impulsive

STRUCTURE: Motive

POSITION: Minute wave (v)

DIRECTION: Upside in wave (v)

DETAILS: We are looking at Minuette wave (iv) reacting to the 0.618 retracement of wave (iv) versus wave (ii). Looking for a bottom in place to then resume the upside trend in wave (v).

CAT Elliott Wave Technical Analysis – Daily Chart

In our Elliott Wave analysis of Caterpillar Inc. (CAT), we observe an impulsive trend pattern with a motive structure. CAT is currently positioned in minute wave (v), indicating an ongoing upward trend. The recent price action shows that Minuette wave (iv) has reacted off the 0.618 retracement level of wave (iv) versus wave (ii), suggesting a potential bottom. This reaction provides a signal that CAT might resume its uptrend into minute wave (v), continuing the impulsive sequence.

Caterpillar-Inc-Day-...


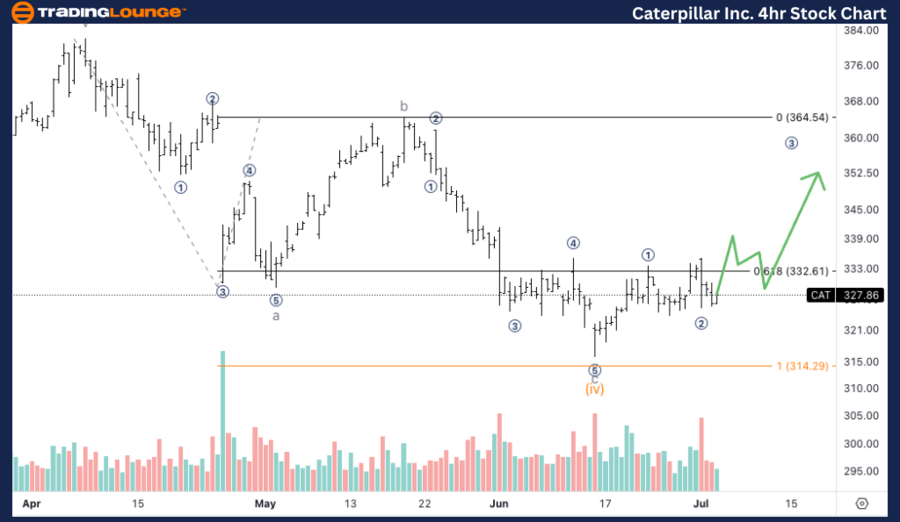
CAT Elliott Wave Analysis Trading Lounge 4Hr Chart

Caterpillar Inc., (CAT) 4Hr Chart Analysis

CAT Stock Technical Analysis

FUNCTION: Trend

MODE: Impulsive

STRUCTURE: Motive

POSITION: Sub-minuette i of (v)

DIRECTION: Five waves into wave i

DETAILS: Looking for a micro wave 1-2 in place, expecting further upside into micro wave 3 looking to take off from Minor Group 1 at $330.

CAT Elliott Wave Technical Analysis – 4Hr Chart

In our Elliott Wave analysis of Caterpillar Inc. (CAT), we observe an impulsive trend pattern with a motive structure. CAT is currently positioned in minute wave (v), indicating an ongoing upward trend. The recent price action shows that Minuette wave (iv) has reacted off the 0.618 retracement level of wave (iv) versus wave (ii), suggesting a potential bottom. This reaction provides a signal that CAT might resume its uptrend into minute wave (v), continuing the impulsive sequence.

Technical Analyst: Alessio Barretta

Source: visit Tradinglounge.com and learn From the Experts Join TradingLounge Here 

See Previous: Apple Inc. (AAPL) Elliott Wave Technical Analysis

Special Trial Offer - 0.76 Cents a Day for 3 Months! Click here

Access 7 Analysts Over 170 Markets Covered. Chat Room With Support

Caterpillar-Inc-4hr-...

Related

Gold Market Analysis: Gold (XAUUSD) Commodity Elliott Wave Technical Analysis and Optimal Entry Points for Long Positions

Gold Market Analysis: Gold (XAUUSD) Commodity Elliott Wave Technical Analysis and Optimal Entry Points for Long Positions

This article provides a detailed Elliott Wave technical analysis of gold, focusing on the bullish tr...

Read More >
Euro/U.S.Dollar(EURUSD) Elliott Wave Technical Analysis 24 January 24

Euro/U.S.Dollar(EURUSD) Elliott Wave Technical Analysis 24 January 24

Euro and U.S. Dollar(EURUSD) Elliott Wave Technical Analysis for 24 January 24 with comprehensive An...

Read More >
Bitcoin/U.S. dollar(BTCUSD) Elliott Wave Technical Analysis 13 October 23

Bitcoin/U.S. dollar(BTCUSD) Elliott Wave Technical Analysis 13 October 23

Elliott Wave Technical Analysis of Bitcoin/U.S. dollar(BTCUSD) 13 October 23

Read More >
Microsoft Corp (MSFT:NASDAQ) Elliott Wave Technical Analysis 20 November 23

Microsoft Corp (MSFT:NASDAQ) Elliott Wave Technical Analysis 20 November 23

Trading Lounge Microsoft Corp.(MSFT: NASDAQ) Elliott Wave Technical Analysis on 20 November 23, MSFT...

Read More >
Zoom Communications (ZM) Elliott Wave Analysis: Unfolding W–X–Y Correction, and ZM Price Outlook with Daily and Weekly Charts

Zoom Communications (ZM) Elliott Wave Analysis: Unfolding W–X–Y Correction, and ZM Price Outlook with Daily and Weekly Charts

Zoom Communications Inc. (ZM) is undergoing a W–X–Y Elliott Wave corrective pattern with the curre...

Read More >
Soybeans Commodity Elliott Wave Technical Analysis: uncovering market trends

Soybeans Commodity Elliott Wave Technical Analysis: uncovering market trends

Dive into a detailed Elliott Wave analysis of Soybeans, uncovering market trends, corrective phases,...

Read More >

$1 for 2 Weeks

then $29 a month!

What a Special Offer!

Trade Recommendations

Unleash the power of deversified trading with our comprehensive portfolio, covering 250+ markets:

  • Stock Trades
  • Crypto Trades
  • Forex Trades
  • Commodity Trades
Elliott Wave Analysis

Gain a competitive edge with expert insights and AI-powered Elliott Wave charting into:

  • Global Indices
  • US Stocks & ASX Stocks
  • Forex & Crypto
  • Commodities
Top-Notch Trading Tools

Equip yourself with the tools of success:

  • Real-time Chat rooms
  • Elliott Wave Algorithm
  • Portfolio tools
  • TradingLevels
  • Screener
  • Trading Game
7 Elliott Wave Analysts

Stay ahead of the market with daily charts and insightful videos
Your secret to strategic trading!

JOIN HERE


Welcome to TradingLounge (ASIC A.R.No. 321187), specialists in trades, trading education and technical analysis, covering stocks, indices, commodities, forex and cryptocurrencies.

When you join TradingLounge you have access to everything we offer, including trade tools, educational content and a social platform to chat with like-minded investors.

Read more

@Copyright 2024 by tradinglounge.com

Contact Us

Australian no: 02 4787 6020

International no: +61 (2) 47876020

Pay with:

Find us on