Gold (XAUUSD) Commodity Elliott Wave Analysis

Function - Counter-Trend

Mode - Corrective

Structure - Triangle for wave 4

Position - Wave 5

Direction - Wave 5 is still in play

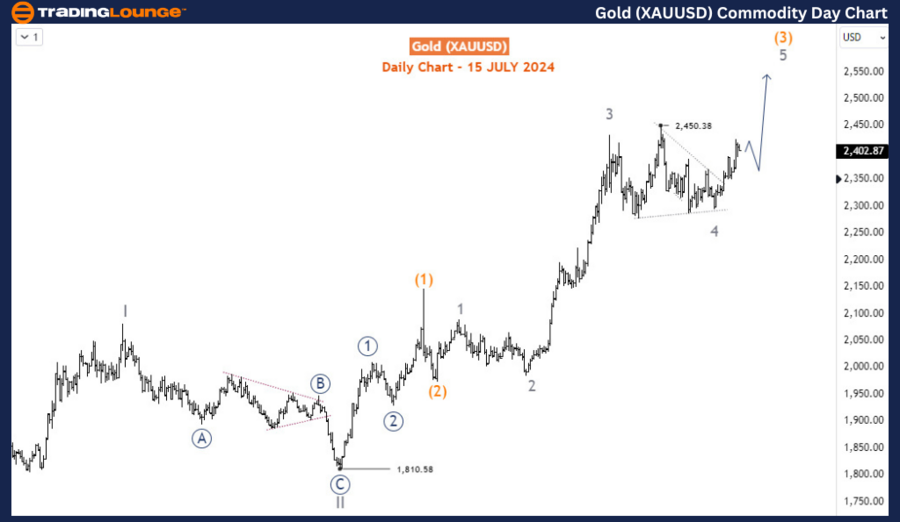
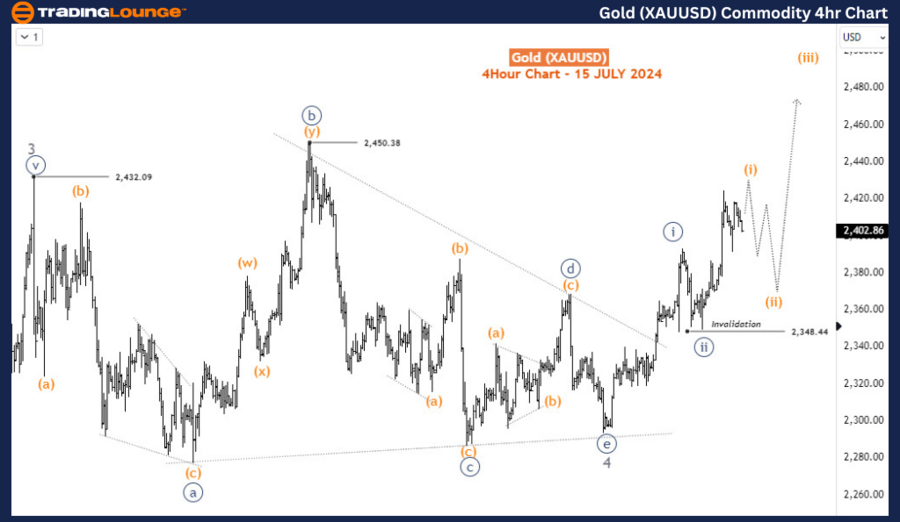
Details - Gold broke out of the triangle, confirming the end of wave 4. Prices are now expected to rally in wave 5. It appears the price is in wave iii (circled) of 5, which could extend to 2500 and above.

Gold Elliott Wave Technical Analysis

Gold has made a decisive breakout from its over 2-month consolidation range by moving higher in early July 2024. This breakout signifies a continuation of the bullish trend initiated in September 2022. In the near term, a pullback is likely before Gold resumes its ascent to reach new all-time highs.

Daily Chart Analysis

Examining the daily chart, we see that the supercycle wave (IV) of the long-term bullish trend, which began in December 2015, has been completed. Following this, Gold embarked on a new impulse wave (V). Within wave (V), waves I and II were completed in May and October 2023, respectively. Gold is currently in wave (3) of III, which has the potential to extend beyond 2500 before it concludes. The recent over 2-month sideways movement represents wave 4 of (3). The current upward movement is part of wave 5 (3), expected to break through to new all-time highs. Consequently, the bullish potential for Gold remains robust. This provides an opportunity for buyers to enter new positions on pullbacks.
Gold-XAUUSD-Commodit...


4-Hour Chart Analysis

On the H4 chart, we can observe the sub-waves of wave 5 of (3) as they unfold. It appears that Gold has completed the first two sub-waves, waves i and ii (circled), and is currently advancing in wave iii (circled). As long as Gold trades above 2293 in the near term, the bullish outlook remains intact, and buyers are likely to continue buying on dips.

The analysis indicates that Gold's bullish momentum is set to continue, driven by the completion of key wave structures and the potential for new highs. Traders should monitor the price action closely, particularly during pullbacks, to identify optimal entry points for long positions. As the market progresses, it will be essential to watch for the completion of wave iii (circled) and subsequent sub-waves to confirm the ongoing bullish trend. With careful analysis and strategic positioning, traders can capitalize on Gold's upward trajectory in the coming months.

Technical Analyst: Sanmi Adeagbo

Source: visit Tradinglounge.com and learn From the Experts Join TradingLounge Here 

See Previous: Soybeans Elliott Wave Technical Analysis

Special Trial Offer - 0.76 Cents a Day for 3 Months! Click here

Access 7 Analysts Over 170 Markets Covered. Chat Room With Support
Gold-XAUUSD-Commodit...

Related

Understand the best Strategies for Navigating Bitcoin’s Price Action: Elliott Wave Analysis and BTCUSD Technical Trends

Understand the best Strategies for Navigating Bitcoin’s Price Action: Elliott Wave Analysis and BTCUSD Technical Trends

This article offers in-depth Bitcoin Elliott Wave analysis, focusing on BTCUSD technical trends, pri...

Read More >
British Pound/ Australian Dollar(GBPAUD) Elliott Wave Technical Analysis 28 November 23

British Pound/ Australian Dollar(GBPAUD) Elliott Wave Technical Analysis 28 November 23

GBPAUD Elliott Wave Analysis Trading Lounge Day Chart" dated 28 November 23, provides an insigh...

Read More >
British Pound/Japanese Yen (GBPJPY) Forex Elliott Wave Technical Analysis: Expert Strategies and Accurate Forecasts

British Pound/Japanese Yen (GBPJPY) Forex Elliott Wave Technical Analysis: Expert Strategies and Accurate Forecasts

Explore comprehensive GBPJPY Elliott Wave Analysis on daily and 4-hour charts. Understand the correc...

Read More >
Identify potential opportunities and key support for Deere & Co. Stock: DE Stocks Elliott Wave Technical Analysis

Identify potential opportunities and key support for Deere & Co. Stock: DE Stocks Elliott Wave Technical Analysis

This comprehensive Elliott Wave analysis for Deere & Co. (DE) provides a detailed examination of DE&...

Read More >
Elliott WaveTechnical Analysis of Iron Ore Market: SGX TSI Index Insights, Price Trends, Technical Forecasts, and Key Market Dynamics

Elliott WaveTechnical Analysis of Iron Ore Market: SGX TSI Index Insights, Price Trends, Technical Forecasts, and Key Market Dynamics

This article offers a comprehensive Elliott Wave analysis of the iron ore market, focusing on price ...

Read More >

Buy 1 Month

Get 3 Months!

Special Offer:

Trade Recommendations

Unleash the power of deversified trading with our comprehensive portfolio, covering:

  • Stock Trades
  • Crypto Trades
  • Forex Trades
  • Commodity Trades
Elliott Wave Analysis

Gain a competive edge with expert insights in to:

  • Global Indices
  • US Stocks & ASX Stocks
  • Forex & Crypto
  • Commodities
Top-Notch Trading Tools

Equip yourself with the tools of success:

  • Social Chat
  • Elliott Wave Algorithm
  • Screener
  • TradingLevels
  • Trading Game
7 Elliott Wave Analysts

Stay ahead of the market with daily charts and insightful videos
-Your secret to strategic trading!

JOIN HERE


Welcome to TradingLounge (ASIC A.R.No. 321187), specialists in trades, trading education and technical analysis, covering stocks, indices, commodities, forex and cryptocurrencies.

When you join TradingLounge you have access to everything we offer, including trade tools, educational content and a social platform to chat with like-minded investors.

Read more

@Copyright 2024 by tradinglounge.com

Contact Us

Australian no: 02 4787 6020

International no: +61 (2) 47876020

Pay with:

Find us on