23Oct

Reliance Industries Stocks Elliott Wave Technical Analysis: Insights into Daily and 4-Hour Charts and Long-Term Market Outlook

TradingLounge  – RELIANCE Elliott Wave Analysis (1D Chart)

Reliance Industries Daily Chart Technical Analysis

RELIANCE Elliott Wave Technical Analysis

Function: Corrective Lower (Intermediate degree, orange)

Mode: Corrective

Structure: Zigzag

Position: Minor Wave 1 (Grey)

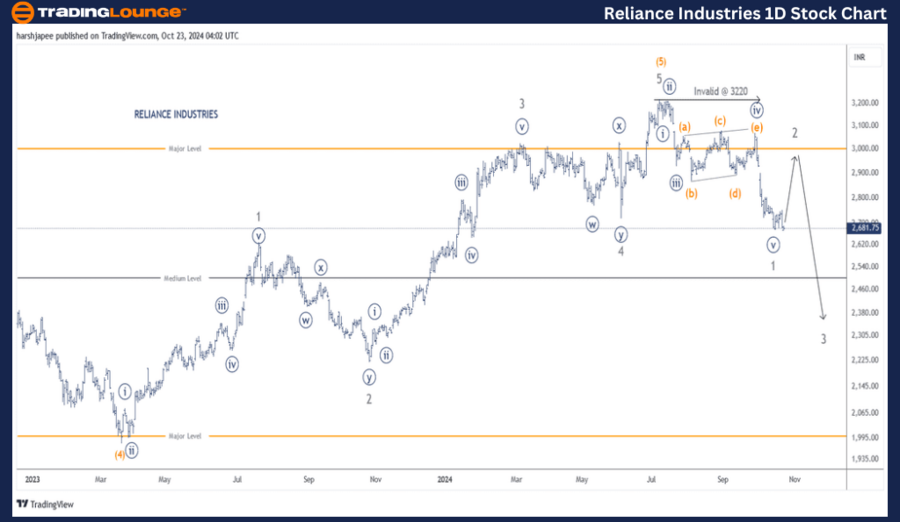
Details: Minor Wave 1 (Grey) is potentially still unfolding, with prices breaking below the 2650 mark. A counter-trend rally is expected to unfold as Minor Wave 2 (Grey) soon, likely pushing towards the 2900-2950 zone, before prices turn lower again.

Invalidation Point: 3220

Reliance Industries Potential Elliott Wave Counts

The daily chart for Reliance Industries shows that a progressive rally has likely terminated around the 3220 high, marked as Intermediate Wave (5) Orange. The decline towards 2650 has unfolded impulsively, suggesting more downside ahead.

Additionally, the price has broken below 2720, which corresponds to the previous Wave 4 (Grey) of a lower degree. Ideally, a pullback is expected before the downtrend resumes. In March 2023, Intermediate Wave (4) had concluded around the 1980 level.

Since then, a five-wave rally reached the 3220 high, identified as Intermediate Wave (5). The subsequent drop to the 2650 level indicates the termination of Minor Wave 1 (Grey). If these Elliott Wave counts remain valid, a rally in Wave 2 is expected to unfold soon.

Reliance-Industries-...


Reliance Industries Elliott Wave Analysis - TradingLounge (4H Chart)

RELIANCE Stock Technical Analysis

Function: Corrective Lower (Intermediate degree, orange)

Mode: Corrective

Structure: Zigzag

Position: Minor Wave 1 (Grey)

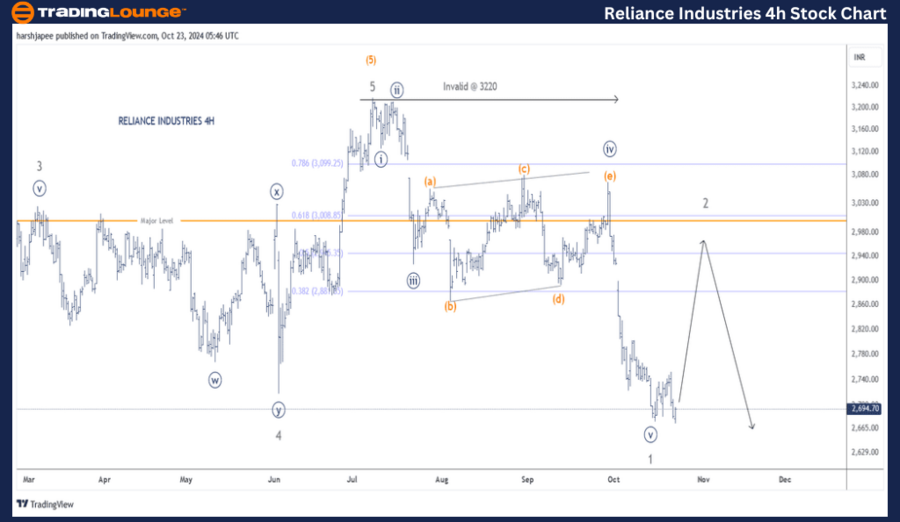
Details: Minor Wave 1 (Grey) appears to still be unfolding, with prices breaking below the 2650 mark. A counter-trend rally is expected to develop in Minor Wave 2 (Grey), potentially heading towards the 2900-2950 zone, before the downtrend resumes with Minor Wave 3 (Grey).

Invalidation Point: 3220

Reliance Industries 4H Chart Technical Analysis and Potential Elliott Wave Counts

The 4-hour chart for Reliance Industries highlights the sub-waves within Minor Wave 3 (Grey) of the larger degree uptrend. The stock rallied up to the 3220 level, terminating Wave 5 (Grey) before possibly reversing the trend. Bears have carved out an impulsive move lower at the Minute degree around 2650, ending Minor Wave 1 (Grey). If this count is correct, expect Wave 2 to unfold as an expanded flat, potentially reaching 2900 in the near term.

Technical Analyst: Harsh Japee

Source: visit Tradinglounge.com and learn From the Experts Join TradingLounge Here 

Previous: HINDUSTAN UNILEVER Elliott Wave Technical Analysis

VALUE Offer - Buy 1 Month & Get 3 Months!Click here

Access 7 Analysts Over 200 Markets Covered. Chat Room With Support

Reliance-Industries-...


Conclusion:

Reliance Industries appears to have turned lower after printing a high of 3220 in July 2024. The stock has completed Minor Wave 1 lower around the 2650 mark and is likely unfolding Minor Wave 2 now.

Related

Stocks Bullish Trend: NASDAQ, AAPL, AMZN, NVDA, TSLA, GOOGL, META, NFLX, MSFT, Elliott Wave Analysis

Stocks Bullish Trend: NASDAQ, AAPL, AMZN, NVDA, TSLA, GOOGL, META, NFLX, MSFT, Elliott Wave Analysis

NASDAQ Stock market Elliott Wave analysis and trading strategies: NASDAQ 100, Apple (AAPL), Tesla (T...

Read More >
Stay ahead with our forecast ASX Stock Analysis & Asx Limited Elliott Wave Technical Forecast

Stay ahead with our forecast ASX Stock Analysis & Asx Limited Elliott Wave Technical Forecast

Our detailed ASX Elliott Wave analysis provides expert technical insights into ASX LIMITED stock. Le...

Read More >
Bitcoin Elliott Wave Technical Analysis: BTCUSD Charts, Trading Strategy, Bullish Momentum, and Price Prediction

Bitcoin Elliott Wave Technical Analysis: BTCUSD Charts, Trading Strategy, Bullish Momentum, and Price Prediction

Bitcoin Elliott Wave Analysis highlights BTCUSD technical charts for both daily and 4-hour timeframe...

Read More >
ASX WTC stock market trends and effective trading strategies Using: Wisetech Global Limited Elliott Wave Technical Forecast

ASX WTC stock market trends and effective trading strategies Using: Wisetech Global Limited Elliott Wave Technical Forecast

Our detailed Elliott Wave analysis of WISETECH GLOBAL LIMITED (WTC) provides valuable insights into ...

Read More >
Euro/U.S.Dollar(EURUSD) Elliott Wave Technical Analysis: Key Insights for Trading Success | 7th February 24

Euro/U.S.Dollar(EURUSD) Elliott Wave Technical Analysis: Key Insights for Trading Success | 7th February 24

EURUSD currency pair with expert Elliott Wave analysis dated 7th February 24. Trends and impulsive m...

Read More >

Buy 1 Month

Get 3 Months!

Special Offer:

Trade Recommendations

Unleash the power of deversified trading with our comprehensive portfolio, covering:

  • Stock Trades
  • Crypto Trades
  • Forex Trades
  • Commodity Trades
Elliott Wave Analysis

Gain a competive edge with expert insights in to:

  • Global Indices
  • US Stocks & ASX Stocks
  • Forex & Crypto
  • Commodities
Top-Notch Trading Tools

Equip yourself with the tools of success:

  • Social Chat
  • Elliott Wave Algorithm
  • Screener
  • TradingLevels
  • Trading Game
7 Elliott Wave Analysts

Stay ahead of the market with daily charts and insightful videos
-Your secret to strategic trading!

JOIN HERE


Welcome to TradingLounge (ASIC A.R.No. 321187), specialists in trades, trading education and technical analysis, covering stocks, indices, commodities, forex and cryptocurrencies.

When you join TradingLounge you have access to everything we offer, including trade tools, educational content and a social platform to chat with like-minded investors.

Read more

@Copyright 2024 by tradinglounge.com

Contact Us

Australian no: 02 4787 6020

International no: +61 (2) 47876020

Pay with:

Find us on