GX Uranium ETF (URA) Elliott Wave Analysis

Function: Counter trend

Mode: Corrective

Structure: Impulse for wave A (circled)

Position: Wave (4) of A (circled)

Direction: Wave (4) is still in play

Details: A bearish impulse from 33.69 is emerging for wave A (circled) and we should see further decline.

Overview of GX URA ETF Elliott Wave Technical Analysis

The GX URA ETF, or Global X Uranium ETF, is designed to track the performance of companies within the uranium industry. This ETF provides investors with a diversified portfolio that includes firms involved in uranium mining, exploration, and production globally. As nuclear power gains recognition as a cleaner energy alternative, the demand for uranium is expected to rise, making the GX URA ETF an appealing option for investors aiming to benefit from the sector's growth.

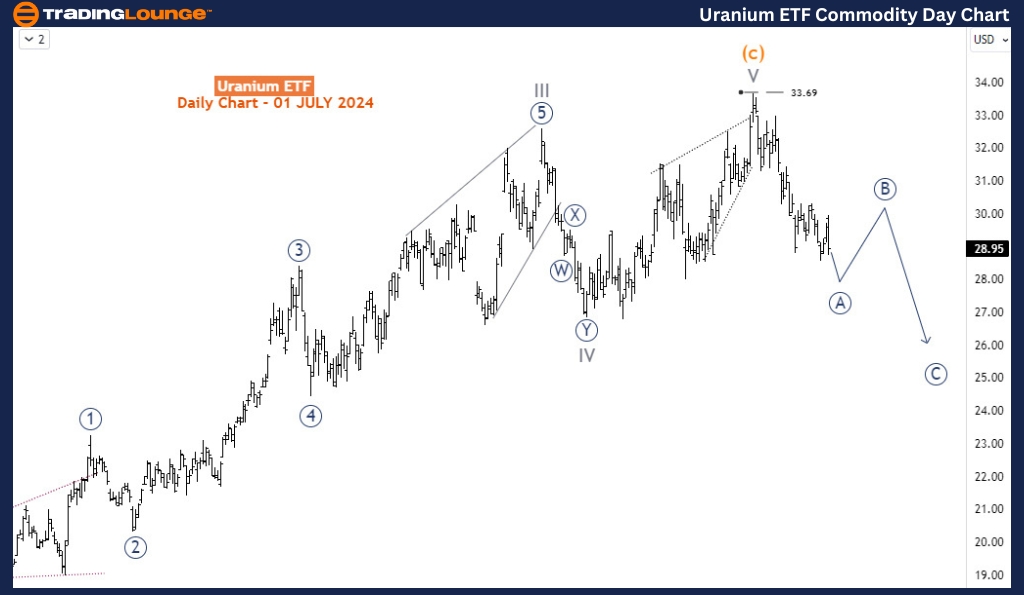
GX Uranium Daily Chart Analysis

Examining the daily chart, the GX Uranium ETF completed a bullish impulse wave cycle in May 2024, peaking at $33.69 from $17.70 in July 2022. This increase represented a gain of over 88% in 26 months. From an Elliott wave perspective, such a significant rise is often followed by a bearish correction. Since reaching $33.69, the ETF has been in a downward correction phase, which typically involves a three-wave bearish correction. The ETF is currently completing the first wave of this correction, known as wave A (circled). After this wave concludes, a corrective bounce for the second wave is expected, followed by another downward move in wave C (circled), which will complete the corrective phase.

Alternatively, a bearish impulse wave decline might drive the ETF price back to $17.70 or even lower. This scenario is possible because the initial impulse sequence to $33.69 marked the completion of wave (c) of a supercycle degree within a larger bullish corrective cycle that began in March 2020. Given both forecasts indicate further decline, the ETF is likely to fall to at least $25 in the upcoming weeks.

Uranium-ETF-Commodit...


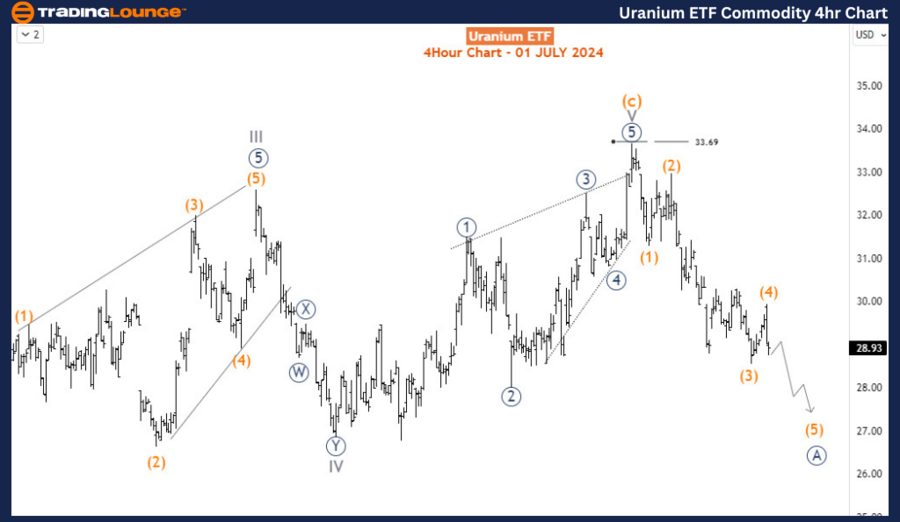
GX Uranium H4 Chart Analysis

On the H4 chart, the bearish impulse wave from $33.69 is still unfolding and is currently in wave (5). There is potential for further extension towards the $27-$28 range, where wave (5) is expected to conclude. Following this, a bullish correction for wave B (circled) could occur, providing temporary relief before the next phase of the bearish correction sets in.

Summary

Overall, the GX URA ETF's recent performance and technical analysis suggest investors should prepare for potential short-term downward movement while considering the long-term opportunities presented by the growth potential of the uranium sector.

Technical Analyst: Sanmi Adeagbo

Source: visit Tradinglounge.com and learn From the Experts Join TradingLounge Here 

See Previous: natural Gas Elliott Wave Technical Analysis

Special Trial Offer - 0.76 Cents a Day for 3 Months! Click here

Access 7 Analysts Over 170 Markets Covered. Chat Room With Support

Uranium-ETF-commodit...

Related

AAVEUSD Elliott Wave Analysis: Price Prediction, Trading Strategy, Support & Resistance Levels, and Market Trends for 2025

AAVEUSD Elliott Wave Analysis: Price Prediction, Trading Strategy, Support & Resistance Levels, and Market Trends for 2025

AAVE/USD Elliott Wave analysis, highlighting Wave V and its potential impact on AAVE price predictio...

Read More >
Theta Token / U.S. dollar(THETAUSD) Elliott Wave Technical Analysis 14 November 23

Theta Token / U.S. dollar(THETAUSD) Elliott Wave Technical Analysis 14 November 23

Theta Token / U.S. dollar(THETAUSD) Elliott Wave Technical Analysis 14 November 23,

Read More >
Explore the Best Trading Strategies For CAR Stock Analysis & Asx Car Group Limited Elliott Wave Technical Analysis

Explore the Best Trading Strategies For CAR Stock Analysis & Asx Car Group Limited Elliott Wave Technical Analysis

This article provides an in-depth Elliott Wave analysis for CAR GROUP LIMITED (CAR.ASX), offering in...

Read More >
New Zealand Dollar/U.S.Dollar (NZDUSD) 4 Hour Chart Elliott Wave Technical Analysis 13 November 23

New Zealand Dollar/U.S.Dollar (NZDUSD) 4 Hour Chart Elliott Wave Technical Analysis 13 November 23

In conclusion, the NZDUSD Elliott Wave Analysis on the 4-hour chart indicates a trending market with...

Read More >
Natural Gas Commodity Elliott Wave Technical Analysis: Covering Critical Resistance Levels, Wave Patterns, and Expected Market Trends

Natural Gas Commodity Elliott Wave Technical Analysis: Covering Critical Resistance Levels, Wave Patterns, and Expected Market Trends

Discover the latest insights on natural gas price movements using Elliott Wave analysis. This articl...

Read More >
TRON Crypto Price News Today Elliott Wave Technical Analysis: A detailed overview of the current market trends for TRXUSD

TRON Crypto Price News Today Elliott Wave Technical Analysis: A detailed overview of the current market trends for TRXUSD

This article provides a detailed Elliott Wave analysis of the TRON/US Dollar (TRXUSD). It includes a...

Read More >

$1 for 2 Weeks

then $29 a month!

What a Special Offer!

Trade Recommendations

Unleash the power of deversified trading with our comprehensive portfolio, covering 250+ markets:

  • Stock Trades
  • Crypto Trades
  • Forex Trades
  • Commodity Trades
Elliott Wave Analysis

Gain a competitive edge with expert insights and AI-powered Elliott Wave charting into:

  • Global Indices
  • US Stocks & ASX Stocks
  • Forex & Crypto
  • Commodities
Top-Notch Trading Tools

Equip yourself with the tools of success:

  • Real-time Chat rooms
  • Elliott Wave Algorithm
  • Portfolio tools
  • TradingLevels
  • Screener
  • Trading Game
7 Elliott Wave Analysts

Stay ahead of the market with daily charts and insightful videos
Your secret to strategic trading!

JOIN HERE


Welcome to TradingLounge (ASIC A.R.No. 321187), specialists in trades, trading education and technical analysis, covering stocks, indices, commodities, forex and cryptocurrencies.

When you join TradingLounge you have access to everything we offer, including trade tools, educational content and a social platform to chat with like-minded investors.

Read more

@Copyright 2024 by tradinglounge.com

Contact Us

Australian no: 02 4787 6020

International no: +61 (2) 47876020

Pay with:

Find us on