We conducted a detailed Elliott Wave analysis for Texas Instruments Inc. (Ticker: TXN), examining both its daily and 4-hour chart movements. This analysis aims to provide valuable insights into potential future price movements for traders and investors interested in TXN stock.

TXN Elliott Wave Analysis Trading Lounge Daily Chart,

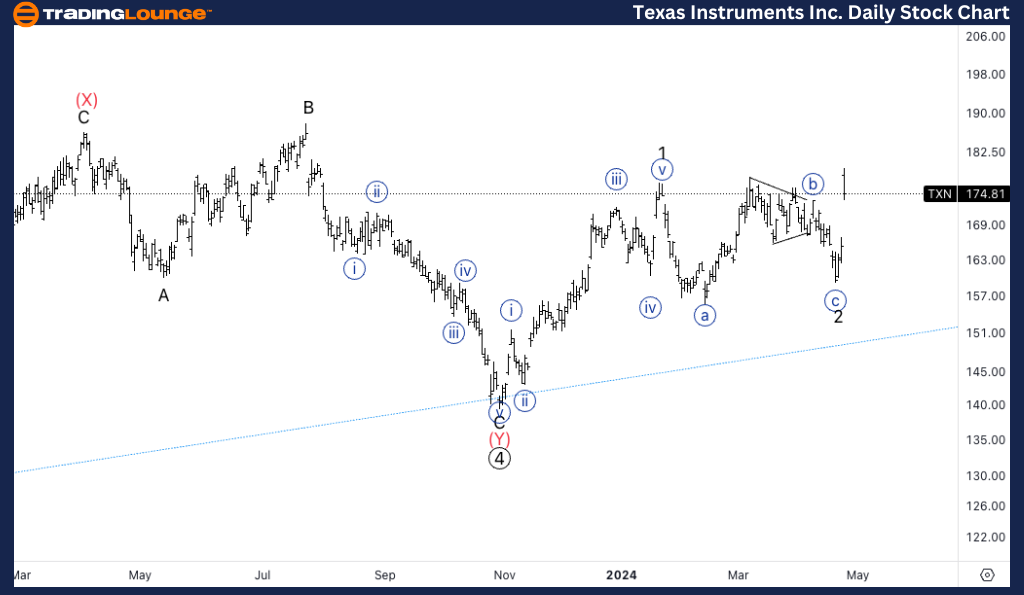
Texas Instruments Inc., (TXN) Daily Chart

TXN Elliott Wave Technical Analysis

FUNCTION: Trend

MODE: Impulsive

STRUCTURE: Motive

POSITION: Intermediate (1)

DIRECTION: Acceleration in wave 3.  

DETAILS: Looking for an upside in wave 3 as we seem to have had a shallow wave {c} of 2, potentially indicating a strong upward momentum.

TXN Elliott Wave Technical Analysis – Daily Chart

Texas Instruments Inc. is currently exhibiting a strong impulsive trend, characterized by a motive structure placed in Intermediate wave (1). The stock is anticipated to experience acceleration in wave 3 following a shallow wave {c} of 2. This suggests a robust upward momentum, signaling favorable conditions for bullish positions.

Texas-Instruments-In...


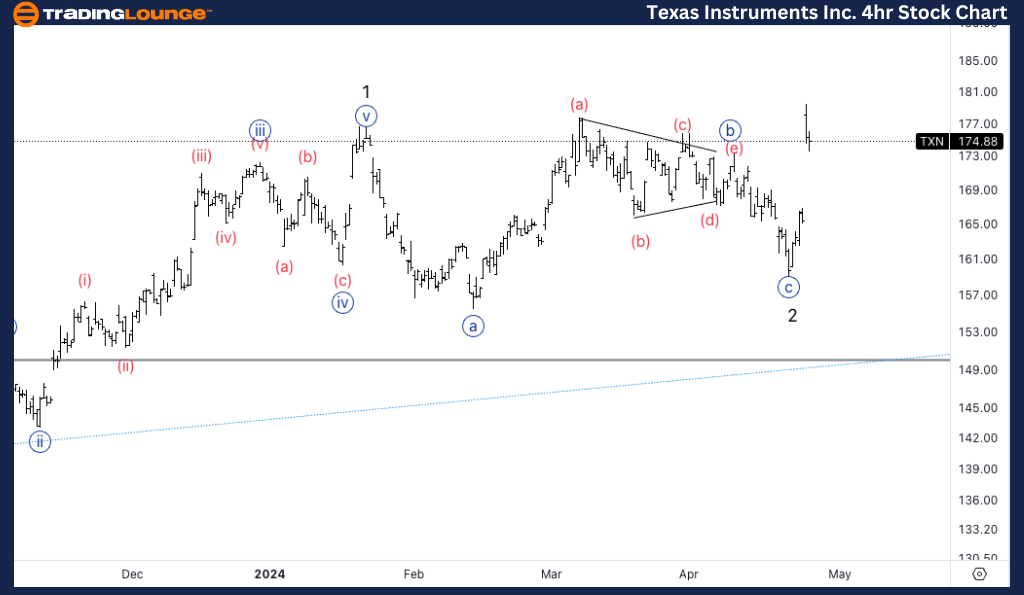
TXN Elliott Wave Analysis Trading Lounge 4Hr Chart,

Texas Instruments Inc., (TXN) 4Hr Chart

TXN Elliott Wave Technical Analysis

FUNCTION: Trend

MODE: Impulsive

STRUCTURE: Motive

POSITION: Wave {i} of 3.

DIRECTION: Top in wave {i}.

DETAILS: Looking for a pullback in wave {ii} as we top in wave {i} to then look for additional longs, looking for 172$ to provide support.

TXN Elliott Wave Technical Analysis – 4Hr Chart

On the 4-hour chart, TXN's impulsive trend is further evident, with the stock positioned in Wave {i} of 3. As the stock approaches the top in wave {i}, a pullback is expected in wave {ii}. This corrective phase presents an opportunity for traders to consider additional long positions, with the key support level identified around $172.

Technical Analyst: Alessio Barretta

Source: visit Tradinglounge.com and learn From the Experts Join TradingLounge Here 

See Previous: Johnson & Johnson (JNJ) Stocks

Special Trial Offer - 0.76 Cents a Day for 3 Months!  Click here
Access 6 Analysts covering over 150 Markets. Chat Room With Support


Texas-Instruments-In...

Related

Silver Price Forecast: Elliott Wave Analysis Predicts Strong Wave 3 Breakout After Completing Wave 2 Correction Above $28

Silver Price Forecast: Elliott Wave Analysis Predicts Strong Wave 3 Breakout After Completing Wave 2 Correction Above $28

Silver remains in a bullish uptrend, currently correcting before an expected wave 3 breakout above 2...

Read More >
Asx Stock's Potential Movement Stay Updated with our NWS Stock Analysis & Elliott Wave Technical Forecast

Asx Stock's Potential Movement Stay Updated with our NWS Stock Analysis & Elliott Wave Technical Forecast

Our detailed Elliott Wave analysis on ASX: News Corporation (NWS) provides a comprehensive outlook o...

Read More >
MAHINDRA & MAHINDRA Elliott Wave Analysis: Navy Blue Wave 3 & Gray Wave 5 Progression Above Key Level 2427

MAHINDRA & MAHINDRA Elliott Wave Analysis: Navy Blue Wave 3 & Gray Wave 5 Progression Above Key Level 2427

Elliott Wave analysis of Mahindra & Mahindra, both daily and weekly charts confirm a bullish impulsi...

Read More >
Insightful Day and 4-Hour Chart Review: British Pound/Japanese Yen(GBPJPY) Forex Elliott Wave Technical Analysis

Insightful Day and 4-Hour Chart Review: British Pound/Japanese Yen(GBPJPY) Forex Elliott Wave Technical Analysis

This comprehensive guide offers detailed GBPJPY trading analysis, focusing on Elliott Wave forecasts...

Read More >
VeChain / U.S. dollar(VETUSD) Elliott Wave Technical Analysis 26 January 24

VeChain / U.S. dollar(VETUSD) Elliott Wave Technical Analysis 26 January 24

TradingLounge Daily Chart and 4-Hour Chart for VeChain/U.S. dollar Elliott Wave Technical Analysis d...

Read More >

$1 for 2 Weeks

then $29 a month!

What a Special Offer!

Trade Recommendations

Unleash the power of deversified trading with our comprehensive portfolio, covering 250+ markets:

  • Stock Trades
  • Crypto Trades
  • Forex Trades
  • Commodity Trades
Elliott Wave Analysis

Gain a competitive edge with expert insights and AI-powered Elliott Wave charting into:

  • Global Indices
  • US Stocks & ASX Stocks
  • Forex & Crypto
  • Commodities
Top-Notch Trading Tools

Equip yourself with the tools of success:

  • Real-time Chat rooms
  • Elliott Wave Algorithm
  • Portfolio tools
  • TradingLevels
  • Screener
  • Trading Game
7 Elliott Wave Analysts

Stay ahead of the market with daily charts and insightful videos
Your secret to strategic trading!

JOIN HERE


Welcome to TradingLounge (ASIC A.R.No. 321187), specialists in trades, trading education and technical analysis, covering stocks, indices, commodities, forex and cryptocurrencies.

When you join TradingLounge you have access to everything we offer, including trade tools, educational content and a social platform to chat with like-minded investors.

Read more

@Copyright 2024 by tradinglounge.com

Contact Us

Australian no: 02 4787 6020

International no: +61 (2) 47876020

Pay with:

Find us on