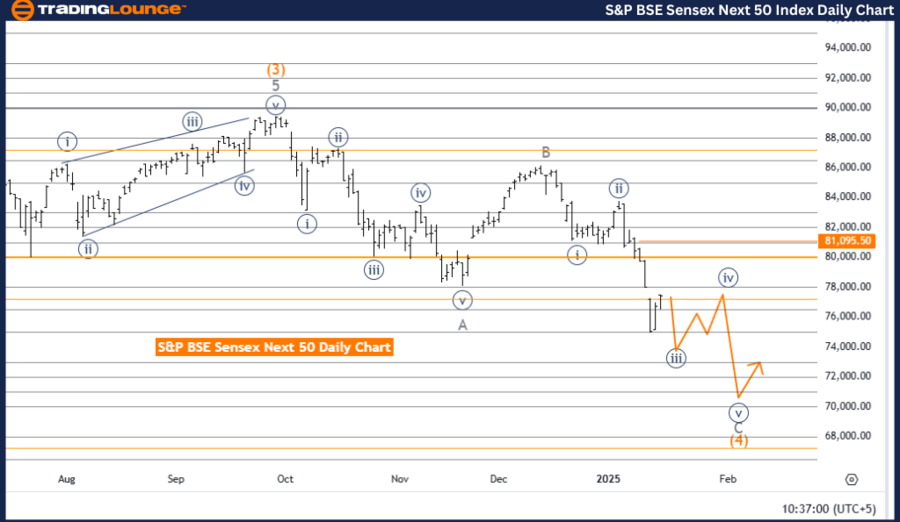
S&P BSE Sensex (India) Elliott Wave Analysis - Day Chart
S&P BSE Sensex (India) Wave Technical Analysis
Key Analysis Details
Function: Counter Trend
Mode: Impulsive
Structure: Gray Wave C
Position: Orange Wave 4
Direction (Next Higher Degrees): Orange Wave 5
Details: Gray wave B of orange wave 4 is complete; gray wave C of orange wave 4 is currently active.
Wave Cancel Invalidation Level: 81,095.50
The S&P BSE Sensex is navigating a counter-trend phase, as observed through Elliott Wave Analysis on the daily chart. The market is showing impulsive characteristics, represented by gray wave C, which forms part of the broader orange wave 4 structure. This phase represents a continuation of the corrective trend within the larger wave cycle.
The completion of gray wave B marks the market's progression into gray wave C. This wave is crucial as it defines the final corrective leg of orange wave 4, paving the way for a potential shift into orange wave 5, which is expected to resume the broader bullish trend.
The wave cancel invalidation level at 81,095.50 serves as a critical benchmark. Any movement below this level would invalidate the current wave scenario, prompting a reassessment of the market’s Elliott Wave structure. This level is essential for confirming the integrity of the analysis and maintaining the framework’s consistency.
Summary
- Counter Trend: The S&P BSE Sensex is currently in a corrective phase.
- Current Phase: Gray wave C of orange wave 4 is unfolding following the completion of gray wave B.
- Impulsive Behavior: Gray wave C represents the final leg of the current corrective trend.
- Next Step: A transition to orange wave 5 is anticipated, resuming the bullish cycle.
- Invalidation Level: 81,095.50 serves as a pivotal reference point for validating the wave’s structure.
The analysis focuses on the completion of the ongoing corrective structure and the expected transition to the next bullish phase represented by orange wave 5.
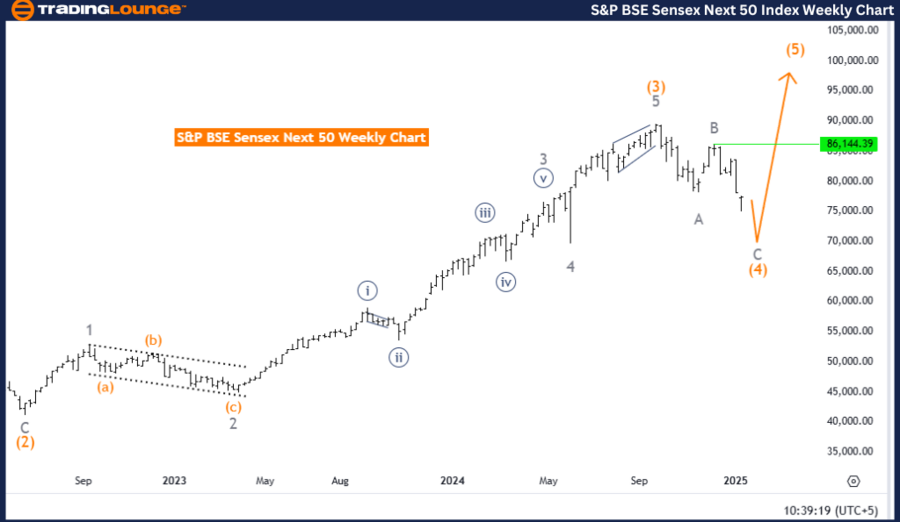
S&P BSE Sensex (India) Elliott Wave Analysis - Weekly Chart
S&P BSE Sensex (India) Wave Technical Analysis
Key Analysis Details
Function: Counter Trend
Mode: Corrective
Structure: Gray Wave C
Position: Orange Wave 4
Direction (Next Higher Degrees): Orange Wave 5
Details: Gray wave B of orange wave 4 is complete; gray wave C of orange wave 4 is currently active.
The S&P BSE Sensex is in a counter-trend phase, as indicated by Elliott Wave Analysis on the weekly chart. The market remains in a corrective mode, driven by gray wave C, which is part of the broader orange wave 4 structure. This phase continues the correction within the larger wave cycle.
Following the conclusion of gray wave B, the market is advancing into gray wave C of orange wave 4. This wave plays a pivotal role in completing the corrective leg and preparing the market for a shift to orange wave 5, which is forecasted to resume the higher-degree bullish trend.
The progression of gray wave C is a key aspect of finalizing the current corrective phase. Once this wave concludes, the market is expected to transition to orange wave 5, marking the next upward movement aligned with the larger bullish trend.
Summary
- Counter Trend: The S&P BSE Sensex is in a corrective phase.
- Current Phase: Gray wave C of orange wave 4 is developing and marks the final corrective phase.
- Next Step: A transition to orange wave 5 is anticipated to resume the broader bullish cycle.
- Significance of Gray Wave C: This wave is essential to completing the ongoing corrective structure and preparing for the next bullish phase.
The analysis highlights the importance of gray wave C in completing the current counter-trend structure and sets the stage for the market to transition into orange wave 5, aligning with the higher-degree bullish framework.
Technical Analyst: Malik Awais
Source: visit Tradinglounge.com and learn From the Experts Join TradingLounge Here
Previous: NIKKEI 225 (N225) Elliott Wave Technical Analysis
VALUE Offer - Buy 1 Month & Get 3 Months!Click here
Access 7 Analysts Over 200 Markets Covered. Chat Room With Support