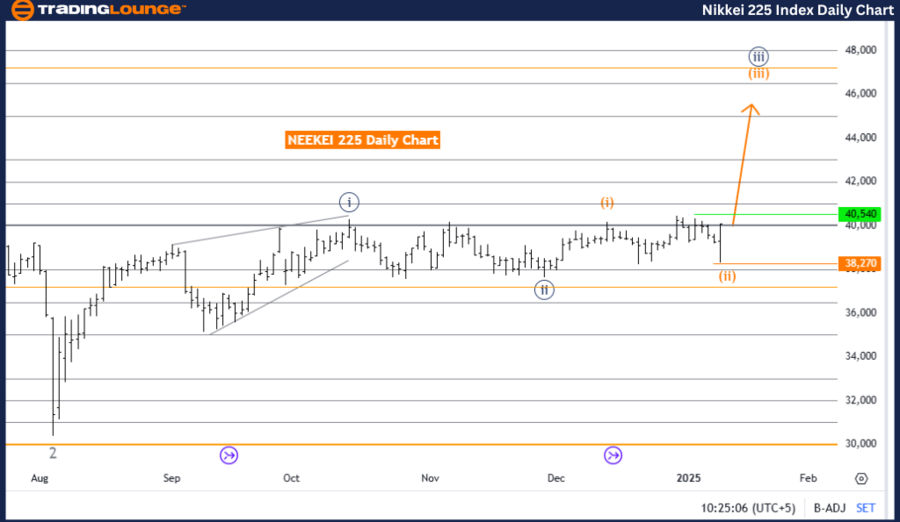
NIKKEI 225 (N225) Elliott Wave Technical Analysis – Daily Chart
NIKKEI 225 Elliott Wave Technical Analysis
Function: Bullish Trend
Mode: Impulsive
Structure: Orange Wave 3
Position: Navy Blue Wave 3
Next Lower Degree Direction: Orange Wave 4
Details: Orange wave 2 appears complete, with orange wave 3 of navy blue wave 3 now progressing.
Wave Cancel Invalidation Level: 38,270
The NIKKEI 225 index showcases a strong bullish trend, as confirmed by Elliott Wave analysis on the daily chart. Currently in an impulsive phase, the orange wave three is unfolding within the larger navy blue wave three. This indicates robust upward momentum and aligns with the continuation of the bullish cycle.
Key Wave Analysis
-
Orange Wave Two:
Orange wave two is complete, setting the stage for the development of orange wave three.
-
Orange Wave Three:
This wave, being impulsive, typically represents the strongest and most dynamic phase of a trend, characterized by substantial price gains. Upon its completion, orange wave four, a corrective pullback, is expected before the resumption of the bullish trend with orange wave five.
-
Invalidation Level:
The wave pattern becomes invalid if the index falls below 38,270, which would necessitate a reassessment of the technical outlook. This level is critical to verifying the ongoing wave scenario.
Summary
The NIKKEI 225 index is firmly in a bullish trend, with orange wave three actively unfolding within navy blue wave three. The completion of orange wave two sets the foundation for the current upward movement. Orange wave four is anticipated as the next corrective phase. The 38,270 invalidation level is a pivotal benchmark to maintain the integrity of the Elliott Wave structure and evaluate future market developments.
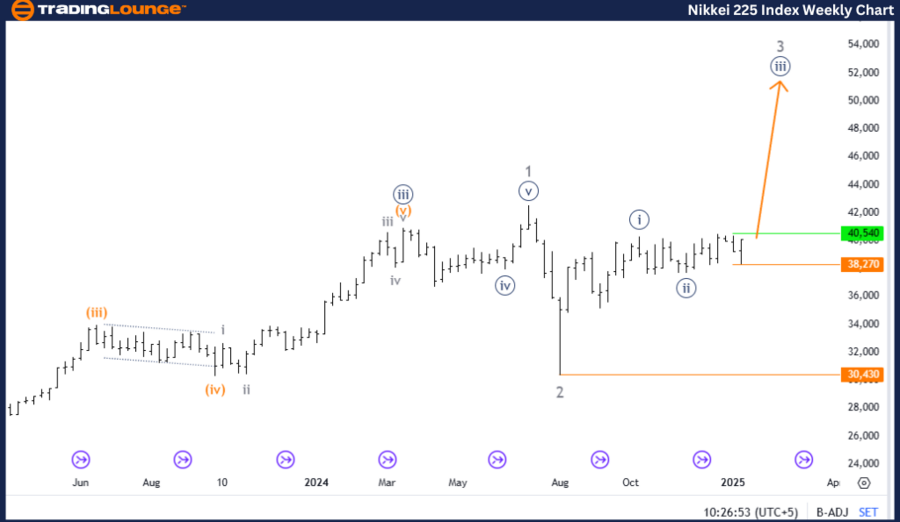
NIKKEI 225 (N225) Elliott Wave Technical Analysis – Weekly Chart
NIKKEI 225 Elliott Wave Technical Analysis
Function: Bullish Trend
Mode: Impulsive
Structure: Navy Blue Wave 3
Position: Gray Wave 3
Next Higher Degree Direction: Navy Blue Wave 3 (ongoing)
Details: Navy blue wave 2 has completed, with navy blue wave 3 of gray wave 3 now advancing.
Wave Cancel Invalidation Level: 30,430
The NIKKEI 225 index continues to reflect a bullish trend based on Elliott Wave analysis of the weekly chart. The market is in an impulsive phase, represented by navy blue wave three within the overarching gray wave three structure. This phase suggests sustained upward momentum, reinforcing the bullish outlook.
Key Wave Analysis
-
Navy Blue Wave Two:
Completion of navy blue wave two has allowed the progression of navy blue wave three.
-
Navy Blue Wave Three:
As an impulsive wave, navy blue wave three typically signifies the most dynamic and extended phase of the trend. This upward movement within gray wave three confirms the strength and continuity of the bullish trajectory.
-
Invalidation Level:
If the index falls below 30,430, the wave structure will be invalidated, requiring a reevaluation of the technical setup. This level serves as a crucial marker for maintaining the Elliott Wave structure’s validity.
Summary
The NIKKEI 225 index is experiencing a strong bullish trend, driven by the ongoing navy blue wave three within gray wave three. The transition from navy blue wave two to this impulsive phase signals intensified upward momentum, emphasizing the continuity of the bullish cycle. The invalidation level at 30,430 is essential for confirming the wave structure and monitoring future developments.
Technical Analyst: Malik Awais
Source: visit Tradinglounge.com and learn From the Experts Join TradingLounge Here
Previous: S&P 500 Elliott Wave Technical Analysis
VALUE Offer - Buy 1 Month & Get 3 Months!Click here
Access 7 Analysts Over 200 Markets Covered. Chat Room With Support