21May

USDCAD Elliott Wave Forecast Reveals Bearish Trend with Key Impulse structures guiding the outlook and Trading Insights

USDCAD Elliott Wave Analysis – Trading Lounge Daily Chart

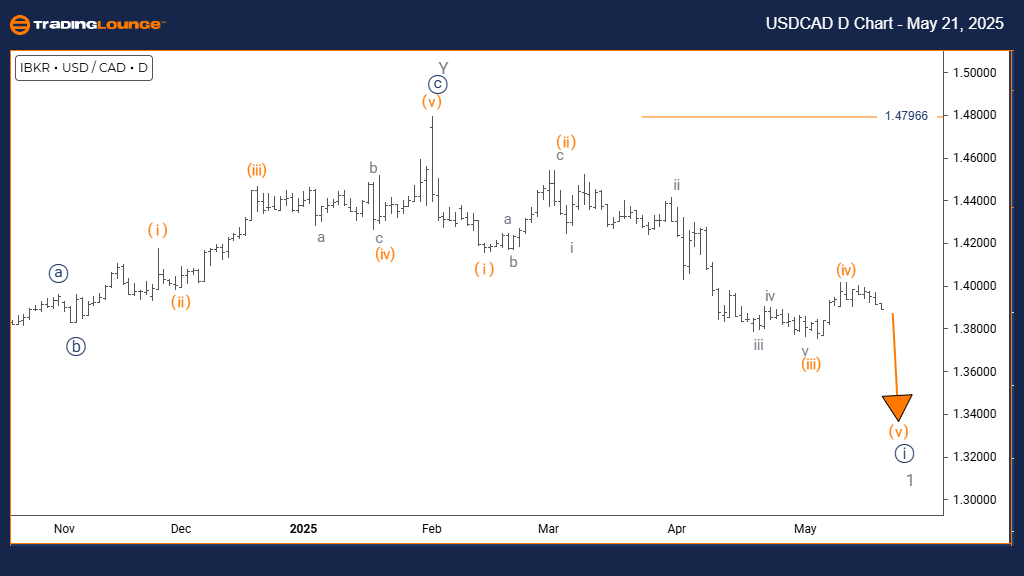
U.S. Dollar / Canadian Dollar (USDCAD) Daily Chart Analysis

USDCAD Elliott Wave Technical Analysis

FUNCTION: Bearish Trend

MODE: Impulsive

STRUCTURE: Navy Blue Wave 1

POSITION: Gray Wave 1

DIRECTION NEXT HIGHER DEGREES: Navy Blue Wave 2

DETAILS: Navy Blue Wave 1 within Gray Wave 1 is currently developing. Invalidation level set at 1.47966.

The Elliott Wave outlook on the USDCAD daily chart highlights a prevailing bearish trend. Current analysis positions the market within Gray Wave 1, with Navy Blue Wave 1 unfolding as an impulsive leg. This configuration points to the early phase of a larger downward structure, reinforcing a negative market outlook.

Price action supports an evolving Navy Blue Wave 1, indicating strong bearish momentum. The market is likely in the beginning stages of a prolonged decline, with sustained selling pressure visible on the daily timeframe. If price breaches the invalidation level at 1.47966, the current wave structure would become void, necessitating a revised wave count.

This ongoing impulsive move is key for understanding USDCAD’s bearish potential. Completion of Navy Blue Wave 1 would transition into Navy Blue Wave 2, anticipated as a corrective phase. Until then, downside movement is expected to persist under the influence of wave dynamics.

Key Takeaways:

  • Wave count favors a bearish continuation in USDCAD.
  • Monitor for validation or invalidation at 1.47966.
  • Completion of current impulse will lead into a corrective wave.

USDCAD-Day-Forex-Cha...


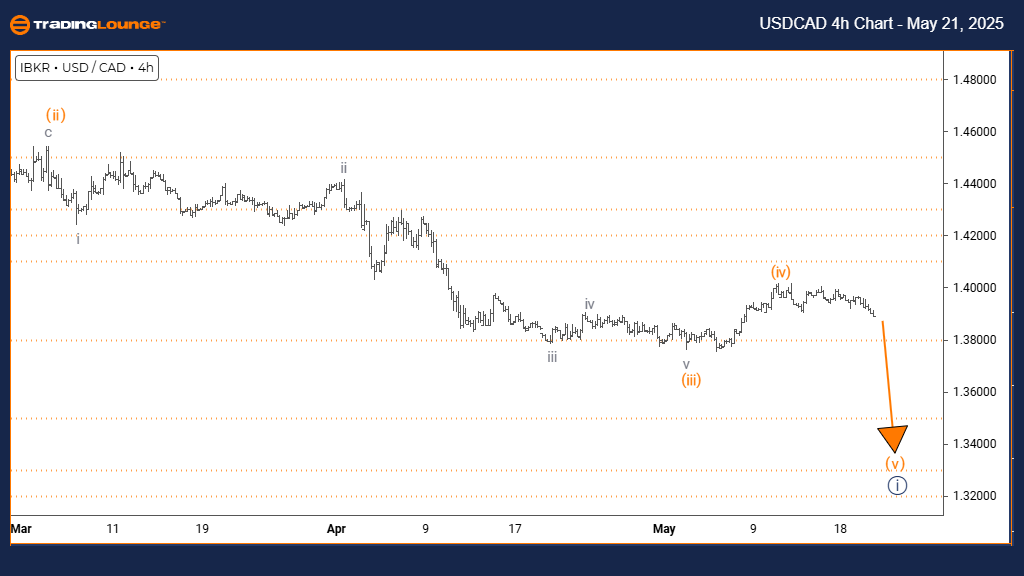
U.S. Dollar / Canadian Dollar (USDCAD) 4-Hour Chart Analysis

USDCAD Elliott Wave Technical Analysis

FUNCTION: Bearish Trend

MODE: Impulsive

STRUCTURE: Orange Wave 5

POSITION: Navy Blue Wave 1

DIRECTION NEXT LOWER DEGREES: Orange Wave 5 (in progress)

DETAILS: Orange Wave 4 is confirmed complete; Orange Wave 5 is active.

The USDCAD 4-hour chart supports a sustained bearish bias, with the Elliott Wave structure confirming that Orange Wave 5 is currently active within Navy Blue Wave 1. This follows the completion of Orange Wave 4, marking the beginning of the final leg in this impulsive sequence.

Evidence of Orange Wave 4’s completion strengthens confidence in a continued downward move via Orange Wave 5. Momentum remains firmly negative, aligning with broader downtrend expectations. As part of the larger wave formation, this phase may continue to extend or begin transitioning to a corrective pattern.

This setup offers actionable insights for traders seeking short opportunities. Monitoring for typical fifth-wave signals—such as slowing momentum or divergence—can assist in fine-tuning entry and exit strategies.

Key Takeaways:

  • Active Orange Wave 5 within Navy Blue Wave 1 indicates more downside.
  • Validates a near-term bearish setup in line with broader wave count.
  • Look for signs of trend exhaustion to manage positions effectively.

Technical Analyst: Malik Awais

Source: Visit Tradinglounge.com and learn from the Experts. Join TradingLounge Here

Previous: AUDUSD Elliott Wave Technical Analysis

VALUE Offer - Buy 1 Month & Get 3 Months!Click here

Access 7 Analysts Over 200 Markets Covered. Chat Room With Support

USDCAD-4h-Forex-Char...

Related

Elliott Wave Analysis: SP500, NASDAQ, DAX 40, FTSE 100, ASX200. Insights & Strategies for Investing

Elliott Wave Analysis: SP500, NASDAQ, DAX 40, FTSE 100, ASX200. Insights & Strategies for Investing

Stay updated with Elliott Wave Analysis ahead of Jobless Claims Thursday. Anticipate completion of c...

Read More >
DOW JONES - DJI Index Elliott Wave Technical Analysis: Understand how these waves impact Dow Jones trading strategies

DOW JONES - DJI Index Elliott Wave Technical Analysis: Understand how these waves impact Dow Jones trading strategies

This article provides a detailed Elliott Wave analysis for the Dow Jones (DJI) index, covering key m...

Read More >
Best Stocks to Buy S&P 500 Index trading with our comprehensive Elliott Wave Technical Analysis

Best Stocks to Buy S&P 500 Index trading with our comprehensive Elliott Wave Technical Analysis

Stay ahead in S&P 500 trading with our comprehensive analysis featuring Elliott Wave insights, daily...

Read More >
Cochlear Limited (ASX:COH) Elliott Wave Forecast Predicts Bullish Impulse Wave With Price Target and Confirmation Levels

Cochlear Limited (ASX:COH) Elliott Wave Forecast Predicts Bullish Impulse Wave With Price Target and Confirmation Levels

This updated Elliott Wave analysis for COCHLEAR LIMITED (ASX: COH) reveals a potential bullish impul...

Read More >
Enhance your Forex Trading Strategies With New Zealand Dollar/U.S. Dollar (NZDUSD) Forex Elliott Wave Technical Analysis

Enhance your Forex Trading Strategies With New Zealand Dollar/U.S. Dollar (NZDUSD) Forex Elliott Wave Technical Analysis

Our detailed Elliott Wave analysis gives a comprehensive understanding of the NZDUSD currency pair. ...

Read More >
Outlines the Future market movements with KOSPI Composite Index Elliott Wave Technical Analysis

Outlines the Future market movements with KOSPI Composite Index Elliott Wave Technical Analysis

This article provides an in-depth Elliott Wave analysis of the KOSPI Composite Index, covering both ...

Read More >

$1 for 2 Weeks

then $29 a month!

What a Special Offer!

Trade Recommendations

Unleash the power of deversified trading with our comprehensive portfolio, covering 250+ markets:

  • Stock Trades
  • Crypto Trades
  • Forex Trades
  • Commodity Trades
Elliott Wave Analysis

Gain a competitive edge with expert insights and AI-powered Elliott Wave charting into:

  • Global Indices
  • US Stocks & ASX Stocks
  • Forex & Crypto
  • Commodities
Top-Notch Trading Tools

Equip yourself with the tools of success:

  • Real-time Chat rooms
  • Elliott Wave Algorithm
  • Portfolio tools
  • TradingLevels
  • Screener
  • Trading Game
7 Elliott Wave Analysts

Stay ahead of the market with daily charts and insightful videos
Your secret to strategic trading!

JOIN HERE


Welcome to TradingLounge (ASIC A.R.No. 321187), specialists in trades, trading education and technical analysis, covering stocks, indices, commodities, forex and cryptocurrencies.

When you join TradingLounge you have access to everything we offer, including trade tools, educational content and a social platform to chat with like-minded investors.

Read more

@Copyright 2024 by tradinglounge.com

Contact Us

Australian no: 02 4787 6020

International no: +61 (2) 47876020

Pay with:

Find us on