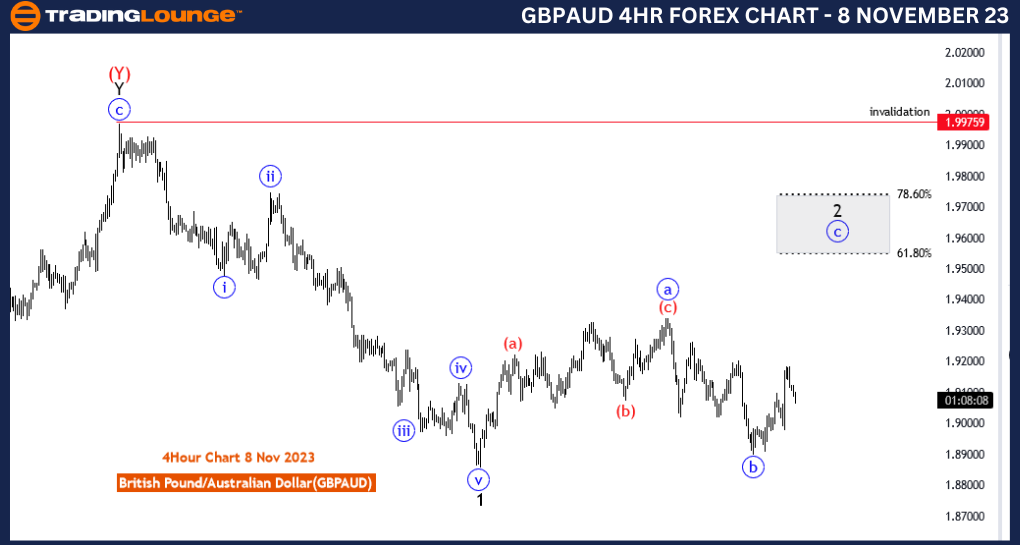
GBPAUD Elliott Wave Analysis Trading Lounge 4 Hour Chart, 8 November 23
British Pound/ Australian Dollar(GBPAUD) 4 Hour Chart
GBPAUD Elliott Wave Technical Analysis
Function: Counter Trend
Mode: Corrective
Structure: Flat
Position: black wave 2
Direction Next lower Degrees:black wave 3
Details: Blue wave C of Black wave 2 is in play(wave 2 as Flat) . Wave Cancel invalid level: 1.99759
The "GBPAUD Elliott Wave Analysis Trading Lounge 4 Hour Chart" dated 8 November 23, presents an in-depth examination of the British Pound/Australian Dollar (GBPAUD) currency pair. The analysis employs Elliott Wave theory, a popular tool among traders and investors for predicting market movements.
The text characterizes the current market situation as "Counter Trend." This suggests that the GBPAUD is currently experiencing a corrective phase, moving against the dominant trend. This information is vital for traders who seek to capitalize on short-term reversals.
The "Mode" is described as "Corrective," indicating that the primary market movement is a correction rather than a strong impulsive trend. Corrective phases typically involve retracements or sideways movements.
The underlying "Structure" of the market is identified as a "Flat," a specific Elliott Wave pattern. This Flat pattern consists of a 3-3-5 wave structure and often signifies a complex correction.
The "Position" within this structure is denoted as "black wave 2." This suggests that the currency pair has likely completed a wave 1 (the initial leg of the correction) and is now undergoing the counter-wave, wave 2.
The "Direction" in the lower degrees is specified as "black wave 3." This indicates that the corrective phase of wave 2 is expected to continue with the development of wave 3, which is the subsequent sub-wave of the correction. Traders may look for opportunities within this corrective movement.
The analysis emphasizes that "Blue wave C of Black wave 2 is in play," providing traders with an insight into the specific sub-wave within the correction that is currently unfolding. Understanding the sub-wave structure is essential for precise entry and exit points.
A vital reference point, termed "Wave Cancel invalid level," is noted as 1.99759. This level is crucial for risk management and serves as the point at which the current wave count would be invalidated.
In summary, the GBPAUD Elliott Wave Analysis reveals a Counter Trend situation with a Corrective Mode characterized by a Flat structure. The market is currently in the black wave 2 correction phase, and traders should keep an eye on the development of the black wave 3 within this correction. The Wave Cancel invalid level provides a significant reference point for risk management, helping traders navigate this corrective phase.

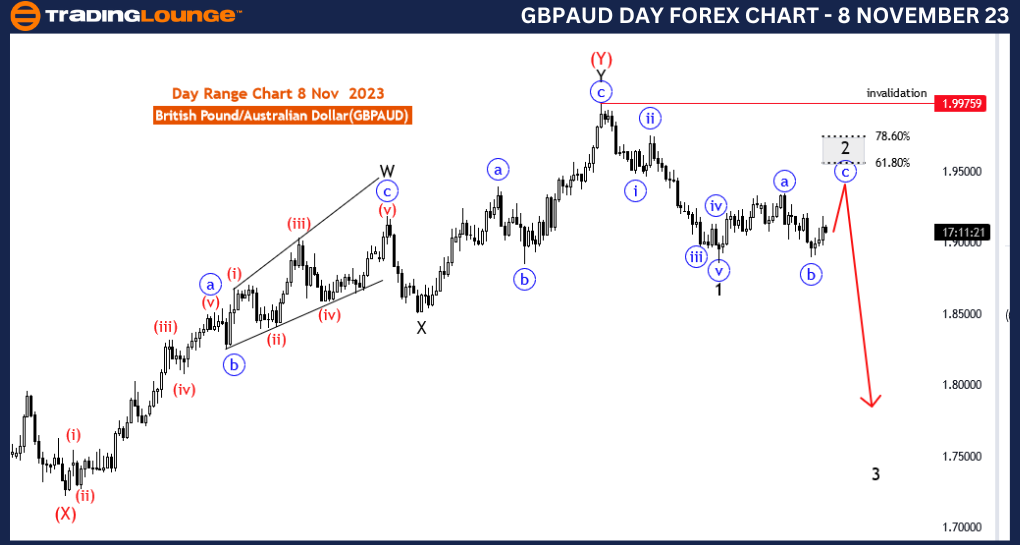
GBPAUD Elliott Wave Analysis Trading Lounge Day Chart, 8 November 23
British Pound/ Australian Dollar(GBPAUD) Day Chart
GBPAUD Elliott Wave Technical Analysis
Function: Counter Trend
Mode: Corrective
Structure: Flat
Position: black wave 2
Direction Next lower Degrees:black wave 3
Details: Blue wave C of Black wave 2 is in play(wave 2 as Flat) . Wave Cancel invalid level: 1.99759
The "GBPAUD Elliott Wave Analysis Trading Lounge Day Chart" for 8 November 23, delves into the intricacies of the British Pound/Australian Dollar (GBPAUD) currency pair, employing Elliott Wave theory to dissect potential market movements.
The text characterizes the prevailing market conditions as "Counter Trend." This label implies that the GBPAUD is currently undergoing a correction, which is a temporary reversal against the predominant trend. This knowledge is valuable for traders looking to seize short-term opportunities.
The analysis classifies the "Mode" as "Corrective." This signifies that the primary market movement is a correction, rather than a robust and unidirectional impulsive trend. Corrective phases often involve price retracements or sideways movements.
The fundamental market "Structure" is recognized as a "Flat." The Flat pattern is a specific Elliott Wave formation characterized by a 3-3-5 wave structure. It is often associated with complex corrections in the market.
The "Position" identified within this structure is "black wave 2." This implies that the currency pair has potentially completed the initial corrective wave (wave 1) and is now involved in a counter-wave, which is wave 2 of the correction.
The direction in the lower degrees is pinpointed as "black wave 3." This conveys that the corrective phase of wave 2 is anticipated to continue, with the development of wave 3, which is the subsequent sub-wave within the correction. This insight can assist traders in identifying suitable entry and exit points within the corrective movement.
The analysis highlights the ongoing status of "Blue wave C of Black wave 2," providing traders with insight into the specific sub-wave unfolding within the correction. An understanding of this sub-wave structure can be instrumental for traders looking to navigate the market successfully.
A crucial reference point known as the "Wave Cancel invalid level" is cited as 1.99759. This level is pivotal for risk management, serving as the threshold at which the current wave count would be deemed invalid.
In summation, the GBPAUD Elliott Wave Analysis indicates a Counter Trend scenario characterized by a Corrective Mode with a Flat structure. The market is currently in the wave 2 correction phase, with the anticipation of wave 3 development. The Wave Cancel invalid level functions as a critical reference point for managing risk in the context of this correction.
