29Apr

BTCUSD Elliott Wave Analysis Predicts Sharp Drop As Wave C Follows 0.618 Resistance Rejection in Zigzag Correction Structure

BTCUSD Elliott Wave Analysis – TradingLounge Daily Chart

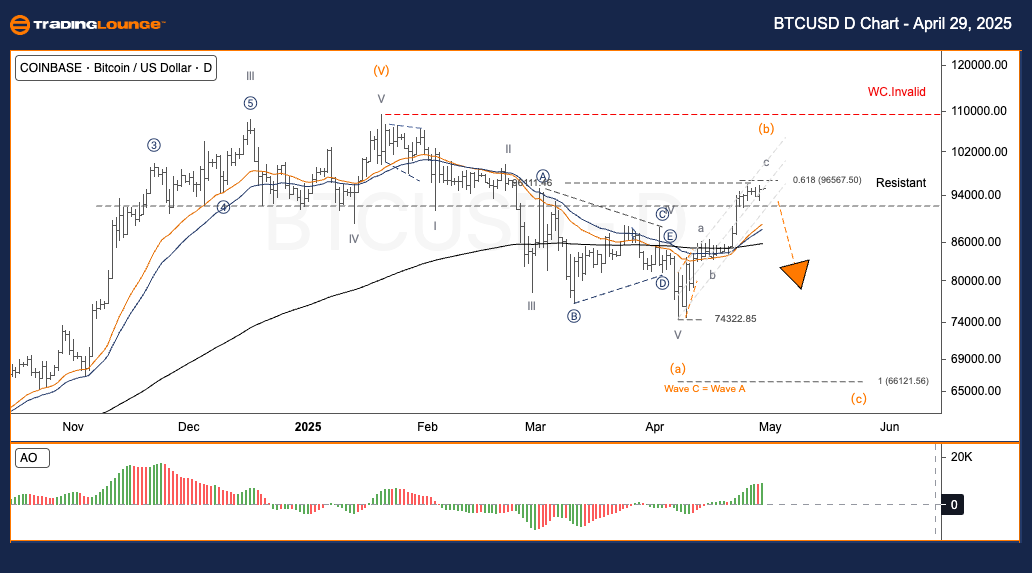
Bitcoin / U.S. Dollar (BTCUSD) Daily Chart Analysis

BTCUSD Elliott Wave Technical Analysis

Function: Counter Trend

Mode: Corrective

Structure: Zigzag

Position: Wave C

Next Direction (Higher Degree): Wave (b)

Invalidation Level: (not specified)

Bitcoin / U.S. Dollar (BTCUSD) Daily Trading Strategy

BTCUSD has rebounded within a classic Elliott Wave a-b-c corrective structure, reaching the 0.618 Fibonacci resistance. Current price behavior reveals signs of exhaustion, indicating that wave (b) may be nearing completion. This positions BTCUSD for a potential decline into wave (c), aligning with typical zigzag corrective patterns seen in crypto markets.

Trading Strategies
Strategy:

  • For Short-Term Traders (Swing Trade): If BTCUSD breaks below 90,817, it would signal the onset of wave (c), with downside targets near 74,322 or lower. This sets up a strong short opportunity in line with Elliott Wave projections.
  • Risk Management: A move above 96,143, and especially a breakout past 109,427, would invalidate the current wave structure, requiring a fresh technical review.

BTCUSD-1d-crypto-cha...


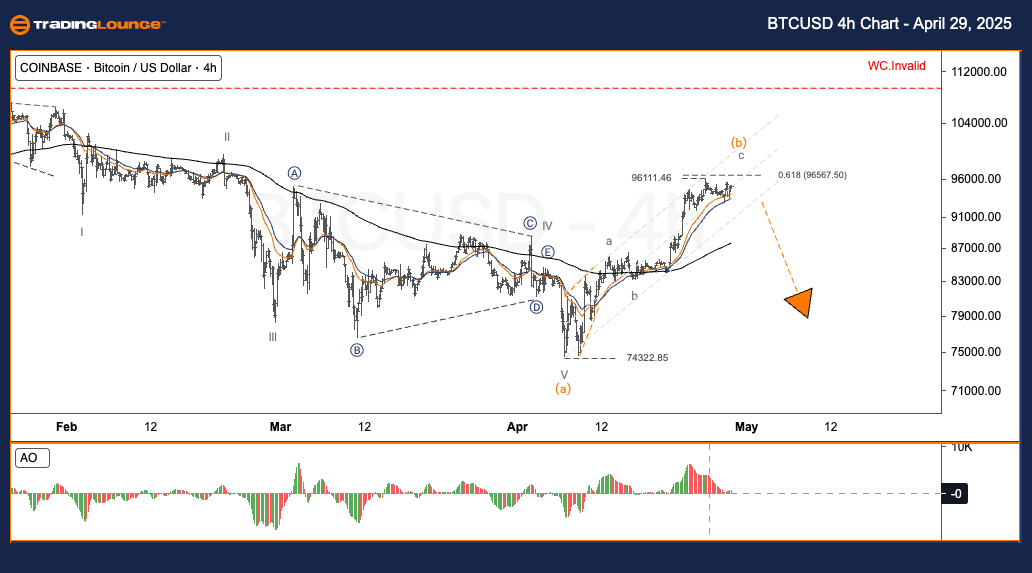
BTCUSD Elliott Wave Analysis – TradingLounge H4 Chart

Bitcoin / U.S. Dollar (BTCUSD) H4 Chart Analysis

BTCUSD Elliott Wave Technical Analysis

Function: Counter Trend

Mode: Corrective

Structure: Zigzag

Position: Wave C

Next Direction (Higher Degree): Wave (b)

Invalidation Level: (not specified)

Bitcoin / U.S. Dollar (BTCUSD) 4-Hour Trading Strategy

On the 4-hour timeframe, BTCUSD completed a sharp rebound inside a corrective a-b-c pattern and encountered resistance at the 0.618 Fibonacci level. Weakening momentum suggests that wave (b) is close to finalizing, increasing the probability of a wave (c) decline, a common development in crypto market corrections.

BTCUSD Trading Strategies

Strategy:

  • For Short-Term Traders (Swing Trade): A decline below 90,817 would confirm the beginning of wave (c), targeting the 74,322 area or lower, offering a potential short trade setup.
  • Risk Management: If BTCUSD rallies above 96,143 and continues through 109,427, the current Elliott Wave count is invalid, and new wave labeling must be considered.

Technical Analyst: Kittiampon Somboonsod, CEWA

Source: Visit Tradinglounge.com and learn from the Experts. Join TradingLounge Here 

Previous: NEOUSD Elliott Wave Technical Analysis

VALUE Offer - Buy 1 Month & Get 3 Months!Click here

Access 7 Analysts Over 200 Markets Covered. Chat Room With Support

BTCUSD-4h-crypto-cha...

Related

ASX Computershare Limited CPU Stock Trends, Price Forecasts, and Elliott Wave Strategies to Capitalize on the Market

ASX Computershare Limited CPU Stock Trends, Price Forecasts, and Elliott Wave Strategies to Capitalize on the Market

Our detailed Elliott Wave analysis of Computershare Limited (CPU.ASX) highlights potential price mov...

Read More >
UnitedHealth Group Inc.(UNH:NYSE) Elliott Wave Technical Analysis 15 January 24

UnitedHealth Group Inc.(UNH:NYSE) Elliott Wave Technical Analysis 15 January 24

United Health Group Inc.(UNH: NYSE) Elliott Wave Technical Analysis dated 15 January 24, In UNH Stoc...

Read More >
Cocoa Commodity Elliott Wave Technical Analysis: Navigating Current Trends and Future Possibilities

Cocoa Commodity Elliott Wave Technical Analysis: Navigating Current Trends and Future Possibilities

Discover the latest insights into the cocoa market with our in-depth Elliott Wave analysis. Learn ab...

Read More >
Unlock the Future of Brambles Limited Stock with Expert BXB Elliott Wave Analysis: ASX Stock Forecast Revealed

Unlock the Future of Brambles Limited Stock with Expert BXB Elliott Wave Analysis: ASX Stock Forecast Revealed

This detailed analysis of Brambles Limited (BXB) on the Australian Stock Exchange (ASX) provides ins...

Read More >
COAL INDIA Indian Stocks Elliott Wave Technical Analysis: Daily & Weekly Stock Forecast with Key Wave Signals

COAL INDIA Indian Stocks Elliott Wave Technical Analysis: Daily & Weekly Stock Forecast with Key Wave Signals

This article delivers a complete Elliott Wave analysis of COAL INDIA, detailing the stock's corr...

Read More >
NIFTY 50 Elliott Wave Analysis: Market Forecast, Key Levels, Trading Strategy & Price Prediction Daily & 4H Chart Insights

NIFTY 50 Elliott Wave Analysis: Market Forecast, Key Levels, Trading Strategy & Price Prediction Daily & 4H Chart Insights

The NIFTY 50 INDEX is currently in a corrective wave structure, approaching the 22,000 - 22,100 zone...

Read More >

$1 for 2 Weeks

then $29 a month!

What a Special Offer!

Trade Recommendations

Unleash the power of deversified trading with our comprehensive portfolio, covering 250+ markets:

  • Stock Trades
  • Crypto Trades
  • Forex Trades
  • Commodity Trades
Elliott Wave Analysis

Gain a competitive edge with expert insights and AI-powered Elliott Wave charting into:

  • Global Indices
  • US Stocks & ASX Stocks
  • Forex & Crypto
  • Commodities
Top-Notch Trading Tools

Equip yourself with the tools of success:

  • Real-time Chat rooms
  • Elliott Wave Algorithm
  • Portfolio tools
  • TradingLevels
  • Screener
  • Trading Game
7 Elliott Wave Analysts

Stay ahead of the market with daily charts and insightful videos
Your secret to strategic trading!

JOIN HERE


Welcome to TradingLounge (ASIC A.R.No. 321187), specialists in trades, trading education and technical analysis, covering stocks, indices, commodities, forex and cryptocurrencies.

When you join TradingLounge you have access to everything we offer, including trade tools, educational content and a social platform to chat with like-minded investors.

Read more

@Copyright 2024 by tradinglounge.com

Contact Us

Australian no: 02 4787 6020

International no: +61 (2) 47876020

Pay with:

Find us on