13May

Nikkei 225 (N225) Elliott Wave Forecast Shows Bullish Wave 3 Structure with Strong Uptrend Signals Across Daily and Weekly Charts

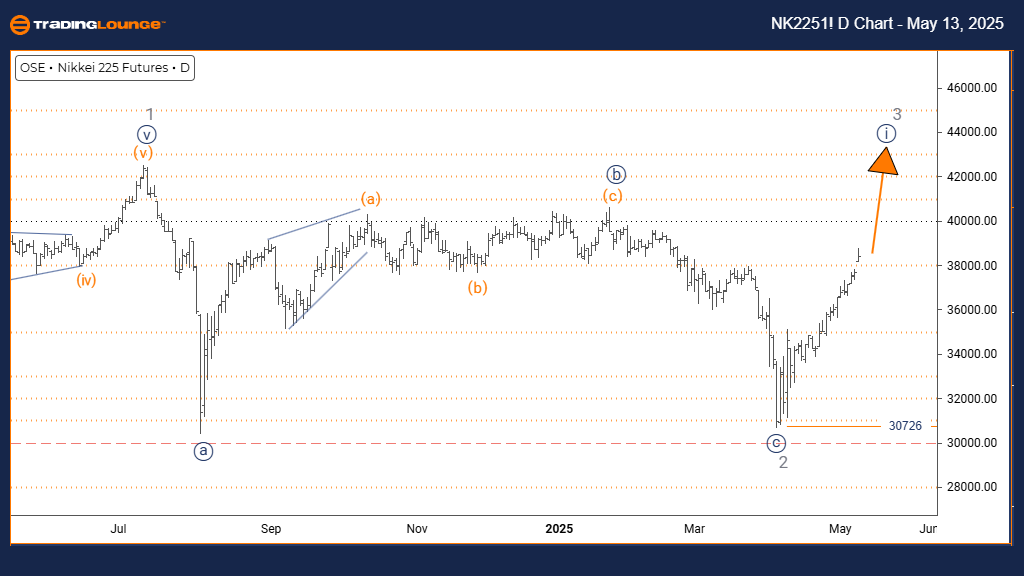
NIKKEI 225 (N225) Elliott Wave Analysis – Trading Lounge Daily Chart

NIKKEI 225 (N225) Elliott Wave Forecast – Daily Timeframe

FUNCTION: Bullish Trend

MODE: Impulsive

STRUCTURE: Navy Blue Wave 1

POSITION: Gray Wave 3

NEXT LOWER DEGREE DIRECTION: Navy Blue Wave 2

DETAILS: Gray Wave 2 has likely ended; Navy Blue Wave 1 of 3 is developing.

INVALIDATION LEVEL: 30,726

The daily Elliott Wave analysis for the Nikkei 225 index highlights a clear bullish trend with impulsive characteristics. The formation of Navy Blue Wave 1 within Gray Wave 3 suggests the market has completed Gray Wave 2 and is moving into a fresh upward cycle. This structure indicates the start of a significant bullish phase, with the current wave acting as the lead wave in the larger move.

Technical evidence confirms Gray Wave 2's completion, leading to a new upward swing. The next expected development is Navy Blue Wave 2, likely presenting a corrective pullback after the current rally. The critical invalidation level of 30,726 must hold to maintain the bullish count. A break below this level could signal a more complex correction or a trend shift. As long as the current impulsive behavior persists, it reflects strong buying interest supporting the bullish momentum.

NIKKEI-d-index-chart...


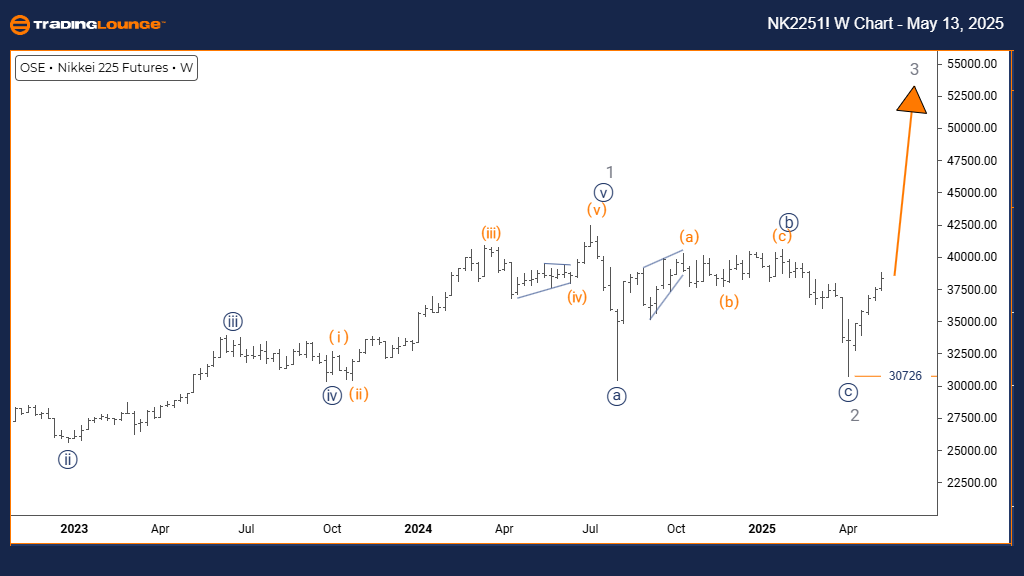
NIKKEI 225 (N225) Elliott Wave Analysis – Trading Lounge Weekly Chart

NIKKEI 225 (N225) Wave Forecast – Weekly Timeframe

FUNCTION: Bullish Trend

MODE: Impulsive

STRUCTURE: Gray Wave 3

POSITION: Orange Wave 3

NEXT HIGHER DEGREE DIRECTION: Gray Wave 3 in progress

DETAILS: Gray Wave 2 has likely ended; Gray Wave 3 of 3 is advancing.

INVALIDATION LEVEL: 30,726

The weekly Elliott Wave chart for the Nikkei 225 index reveals a strong bullish outlook supported by impulsive wave activity. The index is currently progressing within Gray Wave 3, nested inside Orange Wave 3, indicating a robust and sustained rally. The completion of Gray Wave 2 marks a shift into the most dynamic wave phase—Wave 3, known for strong price acceleration in Elliott Wave theory.

This bullish scenario remains intact as long as prices hold above 30,726, the wave count's invalidation level. A breakdown below this level would invalidate the current impulsive structure and suggest a potential trend change. However, the ongoing impulsive pattern implies continued upside potential, possibly driven by institutional buying and broader investor confidence in Japanese equities.

Technical Analyst: Malik Awais

Source: Visit Tradinglounge.com and learn from the Experts. Join TradingLounge Here 

Previous: DOW JONES – DJI Elliott Wave Technical Analysis

VALUE Offer - Buy 1 Month & Get 3 Months!Click here

Access 7 Analysts Over 200 Markets Covered. Chat Room With Support

NIKKEI-w-index-chart...

Related

In-Depth Cocoa Elliott Wave Analysis: Accurate Price Forecasts, Market Trends, and Commodity Trading Strategies

In-Depth Cocoa Elliott Wave Analysis: Accurate Price Forecasts, Market Trends, and Commodity Trading Strategies

Explore our detailed Cocoa Elliott Wave Analysis to stay ahead in the commodity market. Learn about ...

Read More >
Polkadot Elliott Wave Technical Forecast: DOT Crypto Price Set for Reversal as Wave 2 Nears Completion with Strong Wave 3 Ahead

Polkadot Elliott Wave Technical Forecast: DOT Crypto Price Set for Reversal as Wave 2 Nears Completion with Strong Wave 3 Ahead

Polkadot (DOT) is in a wave 2 correction phase, with potential bullish reversal near $3.62–$3.94. E...

Read More >
U.S. Dollar / Canadian Dollar Forex Pair - Elliott Wave Technical USDCAD Analysis Offers Valuable Insights for your Trading Strategy

U.S. Dollar / Canadian Dollar Forex Pair - Elliott Wave Technical USDCAD Analysis Offers Valuable Insights for your Trading Strategy

This article provides an in-depth analysis of USDCAD using the Elliott Wave theory. It covers both i...

Read More >
Bitcoin/ U.S. Dollar (BTCUSD) Elliott Wave Analysis: Fibonacci Targets, Market Trends & Key Support Levels for Smart Investing

Bitcoin/ U.S. Dollar (BTCUSD) Elliott Wave Analysis: Fibonacci Targets, Market Trends & Key Support Levels for Smart Investing

BTCUSD Elliott Wave Analysis provides a technical breakdown of Bitcoin’s price movement, highlighti...

Read More >
CAC 40 Elliott Wave Forecast with Daily and Weekly Chart Analysis Highlighting Corrective Wave Structure and France Stock Market

CAC 40 Elliott Wave Forecast with Daily and Weekly Chart Analysis Highlighting Corrective Wave Structure and France Stock Market

Accurate Elliott Wave forecast for the CAC 40 index with detailed daily and weekly chart analysis. U...

Read More >
Bitcoin Elliott Wave Technical Analysis: BTCUSD Charts, Trading Strategy, Bullish Momentum, and Price Prediction

Bitcoin Elliott Wave Technical Analysis: BTCUSD Charts, Trading Strategy, Bullish Momentum, and Price Prediction

Bitcoin Elliott Wave Analysis highlights BTCUSD technical charts for both daily and 4-hour timeframe...

Read More >

$1 for 2 Weeks

then $29 a month!

What a Special Offer!

Trade Recommendations

Unleash the power of deversified trading with our comprehensive portfolio, covering 250+ markets:

  • Stock Trades
  • Crypto Trades
  • Forex Trades
  • Commodity Trades
Elliott Wave Analysis

Gain a competitive edge with expert insights and AI-powered Elliott Wave charting into:

  • Global Indices
  • US Stocks & ASX Stocks
  • Forex & Crypto
  • Commodities
Top-Notch Trading Tools

Equip yourself with the tools of success:

  • Real-time Chat rooms
  • Elliott Wave Algorithm
  • Portfolio tools
  • TradingLevels
  • Screener
  • Trading Game
7 Elliott Wave Analysts

Stay ahead of the market with daily charts and insightful videos
Your secret to strategic trading!

JOIN HERE


Welcome to TradingLounge (ASIC A.R.No. 321187), specialists in trades, trading education and technical analysis, covering stocks, indices, commodities, forex and cryptocurrencies.

When you join TradingLounge you have access to everything we offer, including trade tools, educational content and a social platform to chat with like-minded investors.

Read more

@Copyright 2024 by tradinglounge.com

Contact Us

Australian no: 02 4787 6020

International no: +61 (2) 47876020

Pay with:

Find us on