12May

DOW JONES – DJI Index Elliott Wave Forecast Shows Bullish Trend with Wave Count Analysis and Key Invalidation Level at 36,642

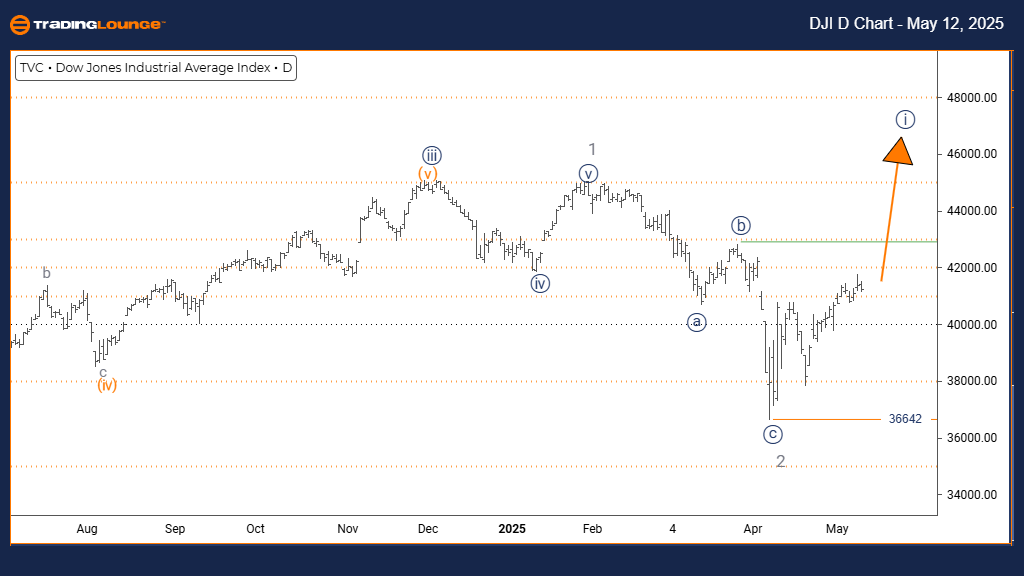
DOW JONES – DJI Elliott Wave Analysis – Trading Lounge Day Chart

DOW JONES – DJI Elliott Wave Technical Analysis

FUNCTION: Bullish Trend

MODE: Impulsive

STRUCTURE: Navy Blue Wave 1

POSITION: Gray Wave 3

DIRECTION NEXT LOWER DEGREES: Navy Blue Wave 2

DETAILS: Gray Wave 2 looks complete; Navy Blue Wave 1 of 3 is developing.

Wave Cancel/Invalidation Level: 36,642

The daily Elliott Wave analysis of the Dow Jones Industrial Average (DJI) indicates a strong bullish trend driven by impulsive wave activity. The market is currently advancing through navy blue wave 1, a sub-wave of the broader gray wave 3. The recent completion of gray wave 2 has opened the path for the next bullish impulse. This setup suggests that the index is entering a significant growth phase, with navy blue wave 1 confirming early momentum.

Looking ahead, navy blue wave 2 is anticipated as the following corrective move once wave 1 concludes. The current wave count remains valid above the key invalidation point of 36,642. A decline below this level could suggest a possible trend reversal or a more intricate corrective pattern.

The presence of impulsive wave action reflects solid bullish market sentiment and increased buying pressure. Traders should monitor the progress of navy blue wave 1 for signs that wave 2 is beginning. This analysis supports the view of a sustained uptrend within the broader Elliott Wave cycle. Staying alert to changes in structure or a break below the invalidation point is crucial for effective market positioning.

DOW-JONES-d-index-ch...


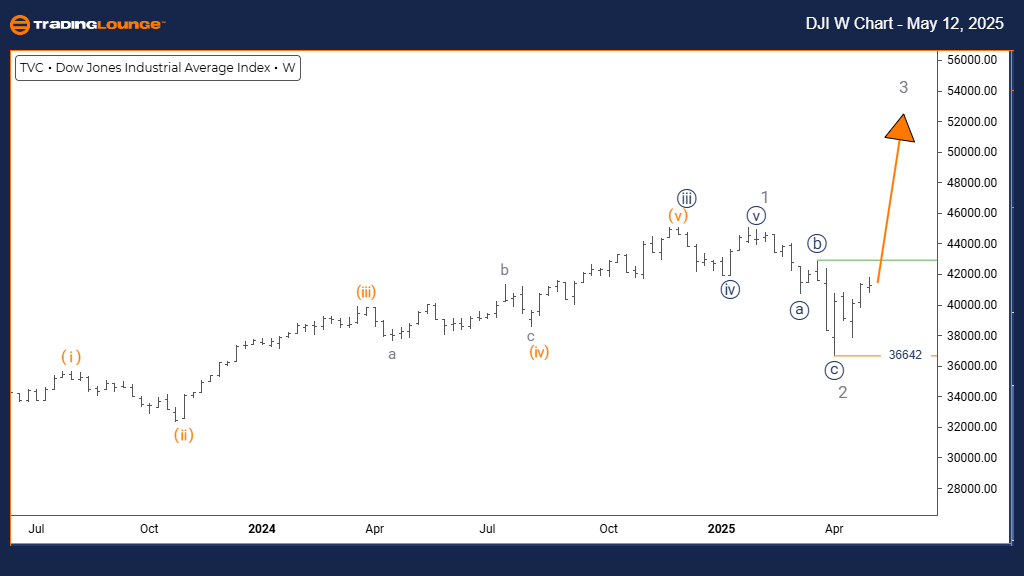
DOW JONES – DJI Elliott Wave Analysis – Trading Lounge Weekly Chart

DOW JONES – DJI Elliott Wave Technical Analysis

FUNCTION: Bullish Trend

MODE: Impulsive

STRUCTURE: Gray Wave 3

POSITION: Orange Wave 3

DIRECTION NEXT HIGHER DEGREES: Gray Wave 3 (active)

DETAILS: Gray Wave 2 seems complete; Gray Wave 3 has likely started.

Wave Cancel/Invalidation Level: 36,642

The weekly Elliott Wave forecast for the Dow Jones Index reinforces a strong bullish trajectory aligned with impulsive wave behavior. The index is positioned within gray wave 3, forming part of the larger orange wave 3 advance. The likely end of gray wave 2 signals a new wave of upward price action, often regarded as a powerful stage in the Elliott Wave sequence.

The next expected movement is the continuation of gray wave 3 within the broader orange wave 3 structure. The wave count remains valid above 36,642, which serves as the invalidation benchmark. A breach below this point could redefine the current outlook toward a more corrective or bearish scenario.

This impulsive phase suggests strong institutional interest and market momentum. Traders should watch for sub-wave formations inside gray wave 3 to verify the ongoing bullish trend. As long as the price stays above the invalidation level, the long-term uptrend outlook remains intact. This analysis provides valuable insight into the Dow's larger bullish pattern, supporting informed trade decisions and trend confirmation strategies.

Technical Analyst: Malik Awais

Source: Visit Tradinglounge.com and learn from the Experts. Join TradingLounge Here 

Previous: Bovespa Index Elliott Wave Technical Analysis

VALUE Offer - Buy 1 Month & Get 3 Months!Click here

Access 7 Analysts Over 200 Markets Covered. Chat Room With Support

DOW-JONES-w-index-ch...

Related

NASDAQ Elliott Wave Forecast Shows Bullish Impulse Structure with Strong Trading Opportunity Based on Market Signals

NASDAQ Elliott Wave Forecast Shows Bullish Impulse Structure with Strong Trading Opportunity Based on Market Signals

The NASDAQ is showing a bullish Elliott Wave pattern with an impulsive wave structure suggesting str...

Read More >
Asx Stock Unibail Rodamco Westfield URW Elliott Wave Technical Forecast: Offers a Clear Outlook on Price Trends and Potential Movements

Asx Stock Unibail Rodamco Westfield URW Elliott Wave Technical Forecast: Offers a Clear Outlook on Price Trends and Potential Movements

Our in-depth Elliott Wave analysis for ASX: UNIBAIL RODAMCO WESTFIELD (URW) offers a clear outlook o...

Read More >
S&P/TSX 60 Elliott Wave Forecast Shows Bullish Momentum with Impulsive Wave Structure in TSX Daily and Weekly Charts

S&P/TSX 60 Elliott Wave Forecast Shows Bullish Momentum with Impulsive Wave Structure in TSX Daily and Weekly Charts

This Elliott Wave analysis of the S&P/TSX 60 shows a bullish wave pattern in both daily and weekly c...

Read More >
TASI Index Elliott Wave Technical Analysis: Daily and Weekly Charts, Offering Insights and Strategies for the Saudi Stock Market

TASI Index Elliott Wave Technical Analysis: Daily and Weekly Charts, Offering Insights and Strategies for the Saudi Stock Market

The TASI Index is showing strong bullish momentum according to Elliott Wave analysis. Key highlights...

Read More >
QCOM Elliott Wave Signals Impulse Rally Ahead as QUALCOMM Targets Breakout Above $150 Resistance in Bullish Wave Setup

QCOM Elliott Wave Signals Impulse Rally Ahead as QUALCOMM Targets Breakout Above $150 Resistance in Bullish Wave Setup

QUALCOMM (QCOM) is showing signs of a bullish reversal near $150. Elliott Wave analysis suggests an ...

Read More >
 Learn Current Market Trends and Expert Insights: BRAMBLES LIMITED Stock Analysis & BXB Elliott Wave Technical Forecast

Learn Current Market Trends and Expert Insights: BRAMBLES LIMITED Stock Analysis & BXB Elliott Wave Technical Forecast

Explore our comprehensive Elliott Wave technical analysis of BRAMBLES LIMITED (BXB) on the ASX. Lear...

Read More >

$1 for 2 Weeks

then $29 a month!

What a Special Offer!

Trade Recommendations

Unleash the power of deversified trading with our comprehensive portfolio, covering 250+ markets:

  • Stock Trades
  • Crypto Trades
  • Forex Trades
  • Commodity Trades
Elliott Wave Analysis

Gain a competitive edge with expert insights and AI-powered Elliott Wave charting into:

  • Global Indices
  • US Stocks & ASX Stocks
  • Forex & Crypto
  • Commodities
Top-Notch Trading Tools

Equip yourself with the tools of success:

  • Real-time Chat rooms
  • Elliott Wave Algorithm
  • Portfolio tools
  • TradingLevels
  • Screener
  • Trading Game
7 Elliott Wave Analysts

Stay ahead of the market with daily charts and insightful videos
Your secret to strategic trading!

JOIN HERE


Welcome to TradingLounge (ASIC A.R.No. 321187), specialists in trades, trading education and technical analysis, covering stocks, indices, commodities, forex and cryptocurrencies.

When you join TradingLounge you have access to everything we offer, including trade tools, educational content and a social platform to chat with like-minded investors.

Read more

@Copyright 2024 by tradinglounge.com

Contact Us

Australian no: 02 4787 6020

International no: +61 (2) 47876020

Pay with:

Find us on