08May

QUALCOMM (QCOM) Technical Analysis Reveals Bullish Elliott Wave Setup with Price Prediction and Trend Forecast on Charts

This analysis explores QUALCOMM Inc. (QCOM) using Elliott Wave Theory across both the daily and 1-hour timeframes, identifying the current wave structure and highlighting potential price movements:

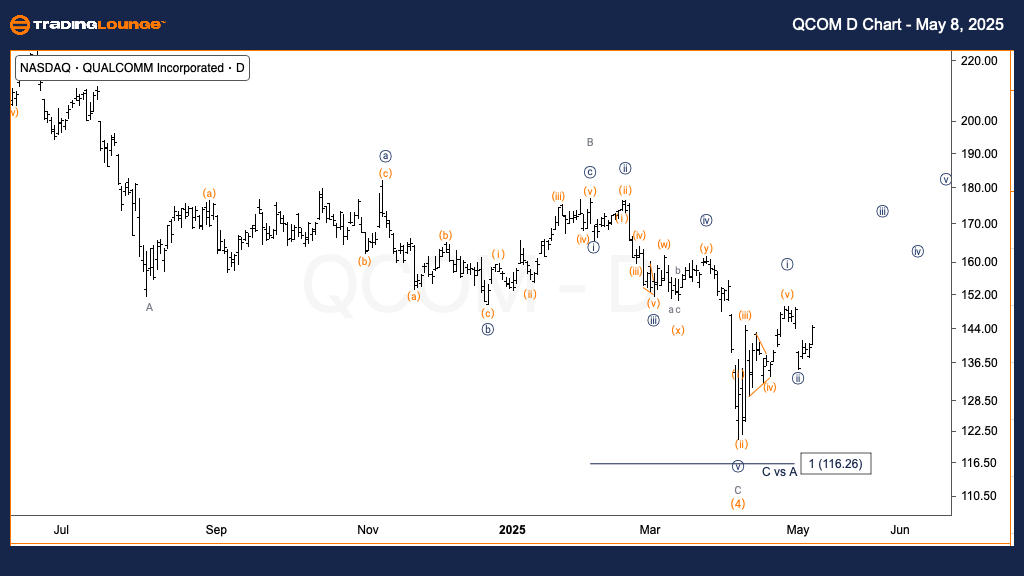
QUALCOMM Inc. (QCOM) Elliott Wave Analysis - TradingLounge Daily Chart

QUALCOMM Inc. (QCOM) Daily Chart Analysis 

QCOM Elliott Wave Technical Analysis

FUNCTION: Trend

MODE: Impulsive

STRUCTURE: Motive

POSITION: Wave {iii} of 1

DIRECTION: Upside in Wave 1

DETAILS: QUALCOMM stock (QCOM) completed a clear {i}-{ii} wave pattern. Price holding above $150 would reinforce a bullish continuation scenario, supporting further gains in the upcoming sessions.

QCOM Elliott Wave Technical Analysis – Daily Chart

The daily chart for QUALCOMM (QCOM) displays an emerging bullish trend under Elliott Wave principles. Waves {i} and {ii} have likely finished, initiating the development of wave {iii}. A decisive move above the $150 level would validate the bullish Elliott Wave structure and could accelerate QCOM’s rally into higher zones, strengthening the stock's technical outlook.

QCOM-US-stock-day-ch...


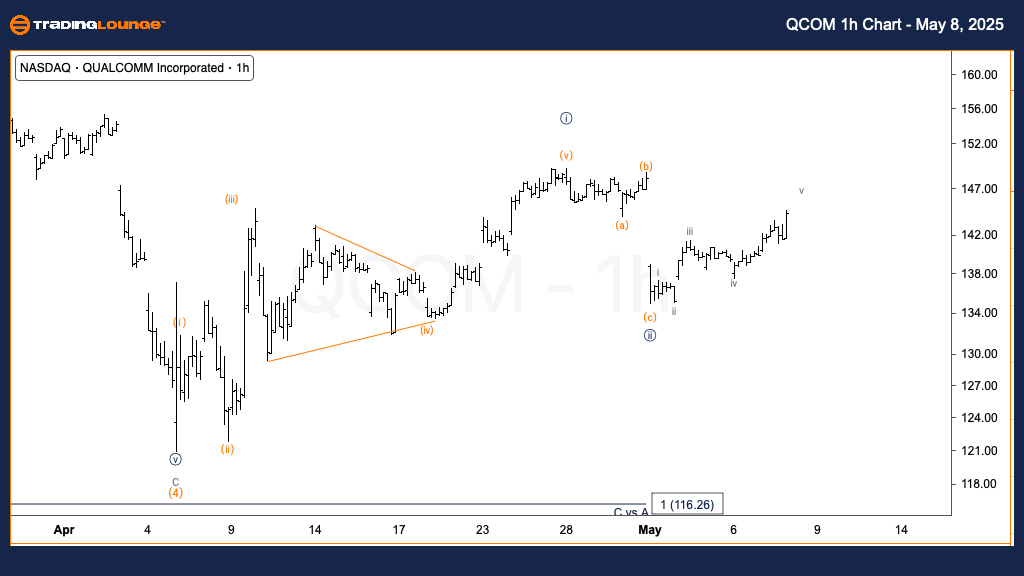
QUALCOMM Inc. (QCOM) Elliott Wave Analysis - TradingLounge 1h Chart

QCOM Elliott Wave Technical Analysis

FUNCTION: Trend

MODE: Impulsive

STRUCTURE: Motive

POSITION: Wave (i) of {iii}

DIRECTION: Upside in Wave {iii}

DETAILS: On the lower timeframe, QCOM completed a three-wave correction. A five-wave impulsive structure appears underway, marking the beginning of wave (i) of {iii}.

QCOM Elliott Wave Technical Analysis – 1H Chart

On the 1-hour chart, QUALCOMM (QCOM) reveals a completed corrective pattern in wave {ii}, followed by a strong five-wave impulsive advance. This wave development indicates the likely formation of wave (i) of {iii}, confirming alignment with the broader bullish trend visible on the daily chart. The current setup in QCOM stock enhances the probability of continued upside momentum, making it an attractive technical setup for trend-following strategies.

Technical Analyst: Alessio Barretta

Source: Visit Tradinglounge.com and learn from the Experts. Join TradingLounge Here 

Previous: Palo Alto Networks Elliott Wave Technical Analysis

VALUE Offer - Buy 1 Month & Get 3 Months!Click here

Access 7 Analysts Over 200 Markets Covered. Chat Room With Support

QCOM-US-stock-1H-cha...

Related

Powerful S&P/ASX 200 Index Elliott Wave Technical Analysis: Uncover Strong Bullish Market Trends and Forecasts

Powerful S&P/ASX 200 Index Elliott Wave Technical Analysis: Uncover Strong Bullish Market Trends and Forecasts

The S&P/ASX 200 continues in a strong bullish trend with both orange wave 3 and navy blue wave 3 act...

Read More >
The Coca-Cola Company (KO:NYSE) Elliott Wave Technical Analysis 21 November 23

The Coca-Cola Company (KO:NYSE) Elliott Wave Technical Analysis 21 November 23

The Coca-Cola Company (KO: NYSE) Elliott Wave Technical Analysis dated 21 November 23, with 4-hour ...

Read More >
Examining CRM's price movements using daily and 4-hour charts: Salesforce Inc. (CRM) Stocks Elliott Wave Technical Analysis

Examining CRM's price movements using daily and 4-hour charts: Salesforce Inc. (CRM) Stocks Elliott Wave Technical Analysis

Discover our latest Elliott Wave analysis for Salesforce Inc. (CRM), thoroughly examining CRM's ...

Read More >
Nifty 50 Elliott Wave Analysis Highlights Bullish Impulse With Key Wave Counts and Support Levels for Informed Trading Strategy

Nifty 50 Elliott Wave Analysis Highlights Bullish Impulse With Key Wave Counts and Support Levels for Informed Trading Strategy

This article analyses Nifty 50 using Elliott Wave theory, identifying bullish trends and impulsive w...

Read More >
Copper Commodity-Elliott Wave Analysis: Highlights Recent Price Movements, Long-term Trends, and Key Chart Patterns

Copper Commodity-Elliott Wave Analysis: Highlights Recent Price Movements, Long-term Trends, and Key Chart Patterns

This comprehensive Copper Elliott Wave analysis highlights recent price movements, long-term trends,...

Read More >

$1 for 2 Weeks

then $29 a month!

What a Special Offer!

Trade Recommendations

Unleash the power of deversified trading with our comprehensive portfolio, covering 250+ markets:

  • Stock Trades
  • Crypto Trades
  • Forex Trades
  • Commodity Trades
Elliott Wave Analysis

Gain a competitive edge with expert insights and AI-powered Elliott Wave charting into:

  • Global Indices
  • US Stocks & ASX Stocks
  • Forex & Crypto
  • Commodities
Top-Notch Trading Tools

Equip yourself with the tools of success:

  • Real-time Chat rooms
  • Elliott Wave Algorithm
  • Portfolio tools
  • TradingLevels
  • Screener
  • Trading Game
7 Elliott Wave Analysts

Stay ahead of the market with daily charts and insightful videos
Your secret to strategic trading!

JOIN HERE


Welcome to TradingLounge (ASIC A.R.No. 321187), specialists in trades, trading education and technical analysis, covering stocks, indices, commodities, forex and cryptocurrencies.

When you join TradingLounge you have access to everything we offer, including trade tools, educational content and a social platform to chat with like-minded investors.

Read more

@Copyright 2024 by tradinglounge.com

Contact Us

Australian no: 02 4787 6020

International no: +61 (2) 47876020

Pay with:

Find us on