07May

Palo Alto Networks Inc. (PANW) Elliott Wave Analysis, Price Prediction, Stock Forecast, and Trading Signals for Short-Term Investors

Palo Alto Networks Inc. (PANW) Elliott Wave Analysis

This Elliott Wave analysis provides a detailed breakdown of Palo Alto Networks Inc. (PANW) trend structure, reviewing both the daily and 1-hour charts. Below is a complete overview of PANW stock's current position and upcoming price movements:


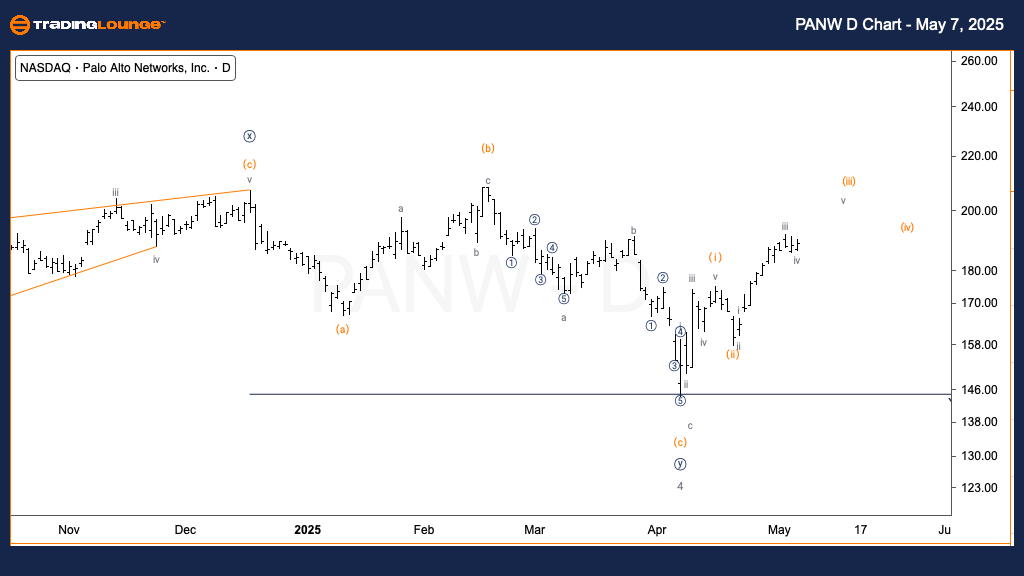
Palo Alto Networks Inc. (PANW) Daily Chart

PANW Elliott Wave Technical Analysis

FUNCTION: Trend

MODE: Motive

STRUCTURE: Impulsive

POSITION: Wave (iii) of {i}

DIRECTION: Uptrend in wave (iii)

DETAILS: Monitoring the development of a five-wave structure in wave {i} to validate the bullish continuation. Currently, a three-wave progression is evident within wave (iii).

PANW Stock Forecast – Daily Chart Overview

Palo Alto Networks (PANW) is progressing higher within wave (iii) as part of a larger bullish Elliott Wave pattern. A three-wave advance has formed so far, pointing to increasing buying strength. Confirmation of a complete five-wave impulsive structure would reinforce the bullish forecast, supporting a continued upward trend for PANW stock.

PANW-d-us-stock-char...


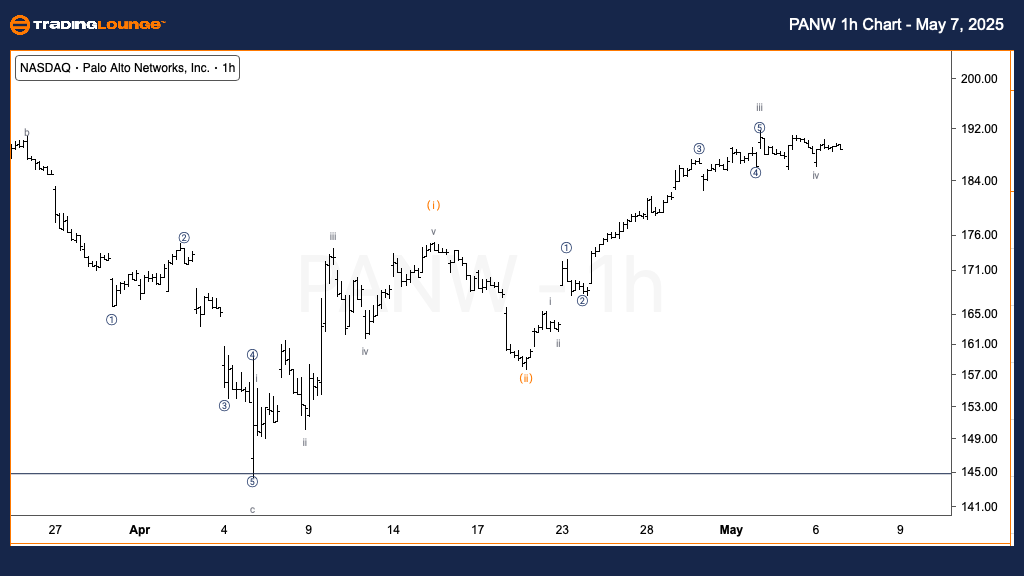
Palo Alto Networks Inc. (PANW) 1H Chart

PANW Elliott Wave Technical Analysis

FUNCTION: Trend

MODE: Motive

STRUCTURE: Impulsive

POSITION: Wave iv of (iii)

DIRECTION: Upside in wave v

DETAILS: Projecting a move higher into wave v, with PANW currently finalizing a consolidation phase within wave iv.

PANW Intraday Stock Analysis – 1H Chart Insight

On the 1-hour chart, Palo Alto Networks (PANW) is consolidating within wave iv of (iii), showing signs of a corrective sideways move. A bullish breakout is expected after wave iv concludes, setting the stage for a potential rally in wave v. This scenario aligns with the overall bullish setup observed on the daily timeframe, offering traders a possible near-term buying opportunity.

Technical Analyst: Alessio Barretta

Source: Visit Tradinglounge.com and learn from the Experts. Join TradingLounge Here 

Previous: Johnson & Johnson (JNJ) Elliott Wave Technical Analysis

VALUE Offer - Buy 1 Month & Get 3 Months!Click here

Access 7 Analysts Over 200 Markets Covered. Chat Room With Support

PANW-1h-us-stock-cha...

Related

Anticipate Future Movements in the Copper Commodity Market with our Expert Analysis: Copper Elliott Wave Technical Analysis

Anticipate Future Movements in the Copper Commodity Market with our Expert Analysis: Copper Elliott Wave Technical Analysis

This comprehensive Copper Elliott Wave Analysis explores recent market trends, price forecasts, and ...

Read More >
Comprehensive Dogecoin/ U.S. dollar (DOGEUSD) Elliott Wave Analysis: Crypto Trading Strategies and Technical Indicators

Comprehensive Dogecoin/ U.S. dollar (DOGEUSD) Elliott Wave Analysis: Crypto Trading Strategies and Technical Indicators

Delve into an in-depth Elliott Wave Technical analysis of Dogecoin/ U.S. dollar(DOGEUSD), revealing ...

Read More >
The Coca-Cola Company (KO) Elliott Wave Technical Analysis 30 January 24

The Coca-Cola Company (KO) Elliott Wave Technical Analysis 30 January 24

KO Stock Market Analysis Trading Lounge Day and 4Hr Chart for The Coca-Cola Company (KO) Elliott Wav...

Read More >
Comprehensive Elliott Wave Analysis of TJX Companies Inc. with Daily and 1-Hour Chart Insights and Stock Projections

Comprehensive Elliott Wave Analysis of TJX Companies Inc. with Daily and 1-Hour Chart Insights and Stock Projections

This Elliott Wave analysis of TJX Companies Inc. (TJX) provides a detailed look at daily and 1-hour ...

Read More >
Dogecoin / U.S. dollar(DOGEUSD) Elliott Wave Technical Analysis 6 November 23

Dogecoin / U.S. dollar(DOGEUSD) Elliott Wave Technical Analysis 6 November 23

Dogecoin / U.S. dollar(DOGEUSD) Elliott Wave Technical Analysis 6 November 23, Dogecoin / U.S. dolla...

Read More >
Natural Gas Commodity Market Outlook: Experiencing a Bearish Trend According to Elliott Wave Technical Analysis

Natural Gas Commodity Market Outlook: Experiencing a Bearish Trend According to Elliott Wave Technical Analysis

Natural Gas is experiencing a bearish trend according to Elliott Wave analysis, with further downsid...

Read More >

$1 for 2 Weeks

then $29 a month!

What a Special Offer!

Trade Recommendations

Unleash the power of deversified trading with our comprehensive portfolio, covering 250+ markets:

  • Stock Trades
  • Crypto Trades
  • Forex Trades
  • Commodity Trades
Elliott Wave Analysis

Gain a competitive edge with expert insights and AI-powered Elliott Wave charting into:

  • Global Indices
  • US Stocks & ASX Stocks
  • Forex & Crypto
  • Commodities
Top-Notch Trading Tools

Equip yourself with the tools of success:

  • Real-time Chat rooms
  • Elliott Wave Algorithm
  • Portfolio tools
  • TradingLevels
  • Screener
  • Trading Game
7 Elliott Wave Analysts

Stay ahead of the market with daily charts and insightful videos
Your secret to strategic trading!

JOIN HERE


Welcome to TradingLounge (ASIC A.R.No. 321187), specialists in trades, trading education and technical analysis, covering stocks, indices, commodities, forex and cryptocurrencies.

When you join TradingLounge you have access to everything we offer, including trade tools, educational content and a social platform to chat with like-minded investors.

Read more

@Copyright 2024 by tradinglounge.com

Contact Us

Australian no: 02 4787 6020

International no: +61 (2) 47876020

Pay with:

Find us on