TradingLounge Elliott Wave Analysis of DOGEUSD Daily Chart, 13 March 24,
In this Elliott Wave analysis update for Dogecoin (DOGEUSD) as of March 13, 2024, we delve into the technical insights, trading strategies, and potential market movements based on the Elliott Wave theory.
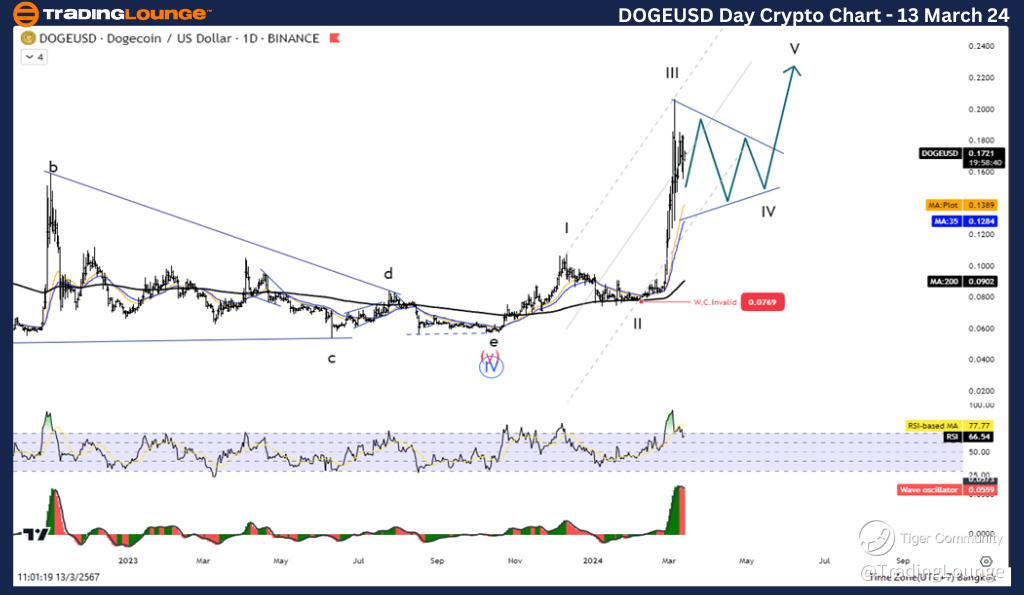
Dogecoin/ U.S. dollar(DOGEUSD) Daily Chart Analysis
DOGEUSD Elliott Wave Technical Analysis
Function: Follow Trend
Mode: Motive
Structure: Impulse
Position: Wave III
Direction Next Higher Degrees: Wave (I) of Impulse
Wave Cancel Invalid Level: 0.0770
DOGEUSD Technical Analysis Details:
The current surge of Wave III is likely to conclude soon, potentially leading to a corrective phase. Traders should remain vigilant for the development of corrective patterns as Wave III nears completion.
DOGEUSD Trading Strategy:
As Dogecoin enters a full uptrend, anticipate a correction in Wave 4 before a subsequent rise in Wave 5. Exercise patience and wait for the completion of the correction phase before considering re-entry into the trend.
DOGEUSD Technical Indicators:
The price action remains above the MA200, indicating a sustained uptrend. Additionally, the Wave Oscillator exhibits bullish momentum, supporting the potential for further upward movement.

DOGEUSD Elliott Wave Analysis TradingLounge 4Hr Chart, 13 March 24,
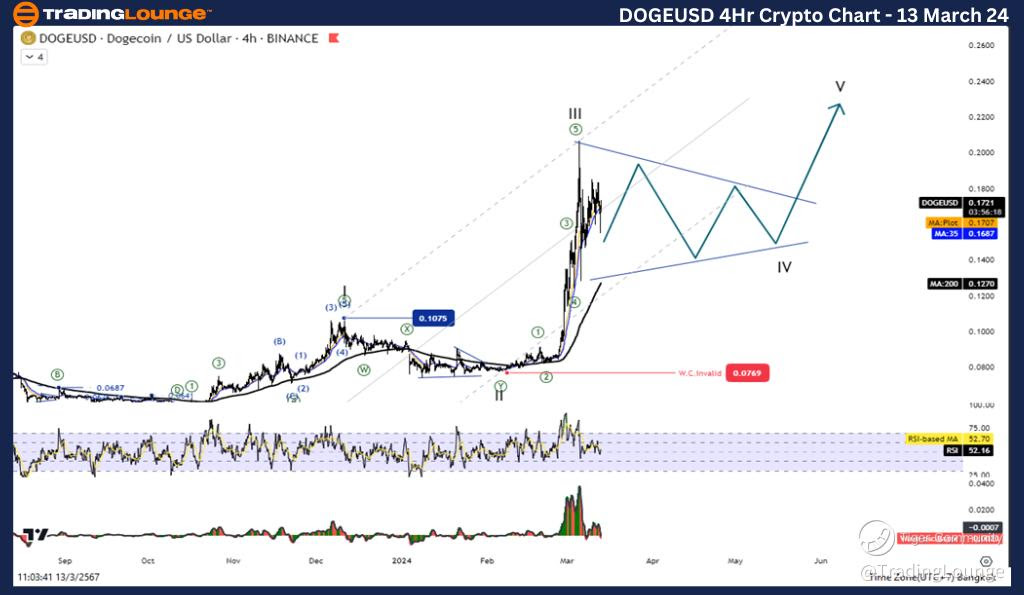
Dogecoin/ U.S. dollar(DOGEUSD) 4Hr Chart Analysis
Elliott Wave Technical Analysis of DOGEUSD
Function: Following Trend
Mode: Motive
Structure: Impulse
Position: Wave III
Direction Next Higher Degrees: Wave (I) of Impulse
Wave Cancel Invalid Level: 0.0770
A closer examination of the 4-hour chart mirrors the observations from the daily timeframe. The impulse structure of Wave III persists, highlighting the continuation of the bullish trend. However, traders must remain cautious of potential corrective movements.
Dogecoin/ U.S. dollar(DOGEUSD) Trading Strategy:
Echoing the sentiment from the daily chart, traders should prepare for a corrective phase as Wave III approaches its culmination. Anticipating the completion of Wave 4 before resuming bullish positions is advisable.
Dogecoin/ U.S. dollar(DOGEUSD) Technical Indicators:
Consistent with the daily analysis, the MA200 indicates an uptrend, reaffirming the bullish trajectory of DOGEUSD. Moreover, the Wave Oscillator sustains its bullish momentum, further validating the upward movement.
In conclusion, Elliott Wave Analysis serves as a robust tool for navigating the complexities of DOGEUSD trading. By adhering to the principles of trend following and recognizing impulse structures, traders can formulate effective strategies to capitalize on market movements. With a comprehensive understanding of technical indicators and wave patterns across different timeframes, traders can make informed decisions to optimize their trading endeavours in the dynamic world of cryptocurrency.
Technical Analyst: Kittiampon Somboonsod, CEWA
Source: visit Tradinglounge.com and learn From the Experts Join TradingLounge Here
See Previous: Chainlink/USD (LINKUSD)
TradingLounge Once Off SPECIAL DEAL: Here > 1 month Get 3 months.
