COAL INDIA LTD – COALINDIA (1D Chart) Elliott Wave Analysis
COAL INDIA Elliott Wave Technical Analysis
Function: Counter Trend Lower (Minor degree, Grey)
Mode: Corrective
Structure: Potential impulse within a larger degree correction
Position: Lower degree Wave ((iv)) – Not labelled on the daily chart
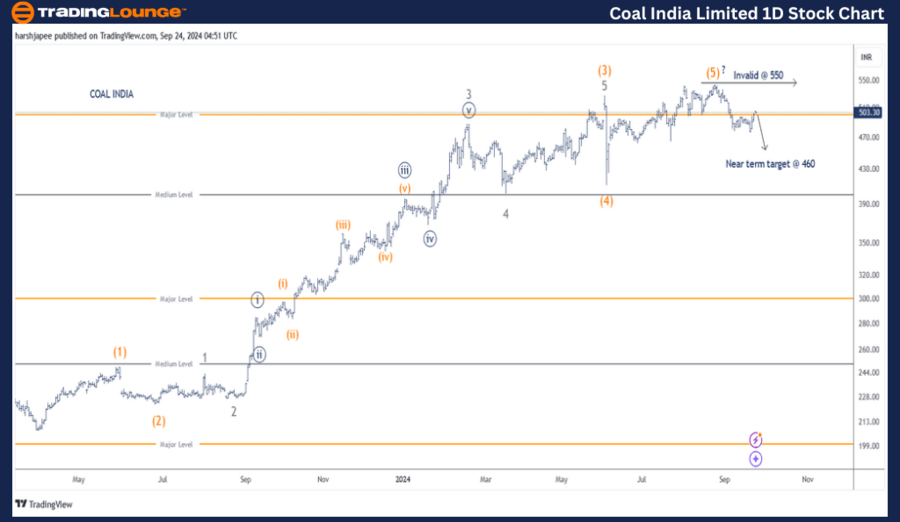
Details: As previously discussed, the alternative wave count may have shifted to the preferred one, with a potential top forming near 550, marking the end of Intermediate Wave (5) Orange. If this wave count is correct, the near-term target could be around 460.
Invalidation Point: 550
COAL INDIA Daily Chart Technical Analysis and Potential Elliott Wave Counts:
The daily chart for COAL INDIA suggests a possible trend reversal, with a potential top at 550, where Intermediate Wave (5) Orange is highlighted. Prices could decline towards the 460 level in the near term to complete the impulse at Minor Degree.
Since hitting a low of 206 in March 2023, COAL INDIA has moved upward, subdividing into Intermediate Waves (1) through (5) Orange. The recent high around 545-550 could represent the completion of Wave (5) Orange, followed by a sharp downward reversal.
If this wave count holds true, bearish control may persist, keeping prices below 550 and potentially driving them to the 460 mark. A break above 550 would invalidate this wave count and suggest a different structure.
COAL INDIA LTD – COALINDIA (4H Chart) Elliott Wave Technical Analysis
Function: Counter Trend Lower (Minor degree, Grey)
Mode: Corrective
Structure: Potential impulse within a larger degree correction
Position: Lower degree Wave ((iv)) – Not labelled on the daily chart
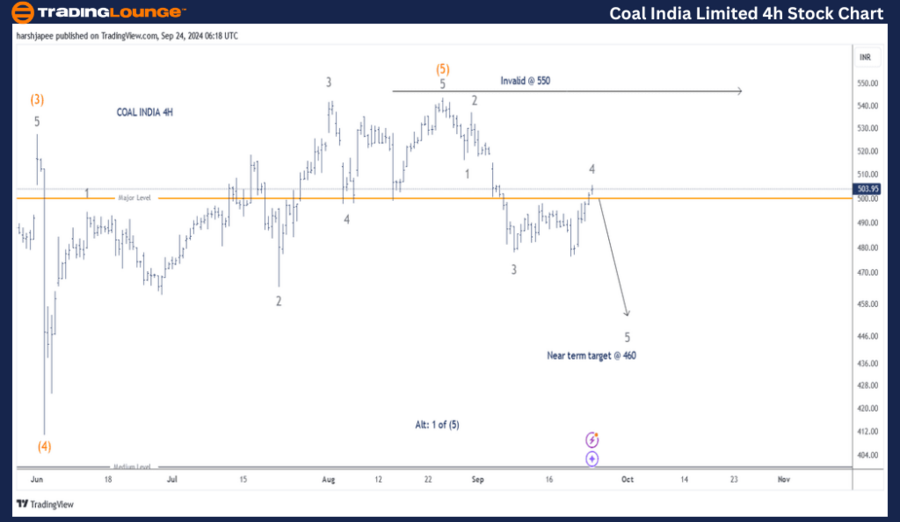
Details: As stated earlier, the alternative wave count may have become the preferred one, with a potential top forming near 550, marking the end of Intermediate Wave (5) Orange. If correct, the near-term target could be around 460. Alternatively, the high at 550 could represent Minor Wave 1 Grey of Intermediate Wave (5) Orange. In this case, the stock should stay above 413.
Invalidation Point: 550
COAL INDIA 4H Chart Technical Analysis and Potential Elliott Wave Counts:
The 4-hour chart for COAL INDIA has been revised, indicating the possible termination of Intermediate Wave (5) Orange around the 550 level. The subsequent movements have been labeled as Minor Waves 1 through 4 Grey on the chart.
If the analysis is correct, the stock could experience another near-term decline towards 460 over the next few trading sessions. Alternatively, the high at 550 may only represent Minor Wave 1 of Intermediate Wave (5), with the recent drop potentially being an expanded flat correction, concluding Minor Wave 2 Grey.
Technical Analyst: Harsh Japee
Source: visit Tradinglounge.com and learn From the Experts Join TradingLounge Here
Previous: Bajaj Finserve Elliott Wave Technical Analysis
VALUE Offer - Buy 1 Month & Get 3 Months!Click here
Access 7 Analysts Over 200 Markets Covered. Chat Room With Support
Conclusion:
COAL INDIA may have shifted to a bearish phase below the 550 high. Prices are now unfolding in what appears to be the first impulse down at Minor Degree, targeting 460 in the near term.