BAJAJ FINSERVE – BAJAJFINSV Stock Analysis (1D Chart)

BAJAJ FINSERVE Elliott Wave Technical Analysis

Function: Larger Trend Higher (Intermediate degree Wave (5), Orange)

Mode: Motive

Structure: Impulse

Position: Minor Wave 3 of Intermediate Wave (5)

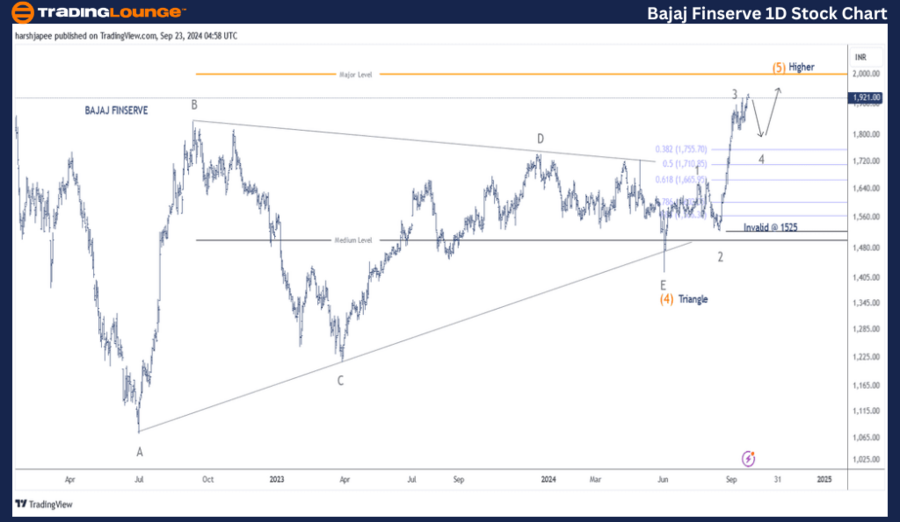
Details: Intermediate Wave (4) Orange completed as a triangle. Minor Wave 3 Grey of Intermediate Wave (5) is nearing completion around the 1920-1930 level. If this analysis holds, we may see a corrective Wave 4 before prices move higher. Alternatively, if Wave 4 has already completed above 1800, Wave 5 Grey could be progressing now.

Invalidation point: 1523

Bajaj Finserve Daily Chart Technical Analysis and Elliott Wave Projections:

Bajaj Finserve's daily chart points towards a continuation of the uptrend, with the potential for Intermediate Wave (5) Orange to reach the 2100 mark. The nearest support level is around 1525, which coincides with the termination of Minor Wave 2 Grey.

Since July 2022, Bajaj Finserve has been forming a triangle pattern for Intermediate Wave (4) Orange, following lows around the 1075 mark. This triangle, subdivided into Minor Waves A through E, concluded near the 1420 level on June 4, 2024.

Intermediate Wave (5) Orange began unfolding after that, with Minor Waves 1, 2, and 3 reaching completion around 1660, 1525, and the 1920-1930 range, respectively. If the wave count is accurate, a sharp corrective Wave 4 could unfold before the final upward move.

Bajaj-Finserve-1D-St...


BAJAJ FINSERVE – BAJAJFINSV Elliott Wave Analysis (4H Chart)

Function: Larger Trend Higher (Intermediate degree Wave (5), Orange)

Mode: Motive

Structure: Impulse

Position: Minor Wave 3 of Intermediate Wave (5)

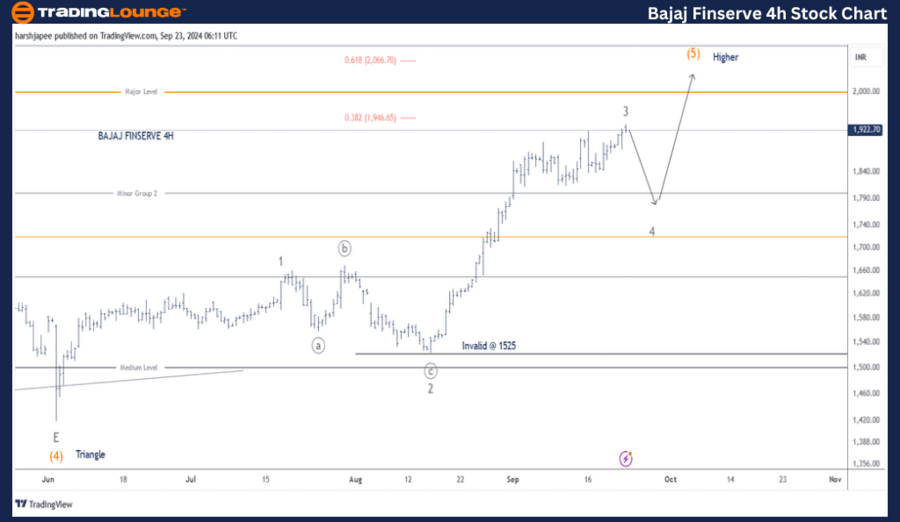
Details: Intermediate Wave (4) Orange has completed as a triangle. Minor Wave 3 Grey of Intermediate Wave (5) appears complete near the 1920-1930 level. If this is correct, we may expect a corrective Wave 4, followed by further upward movement. Alternatively, Wave 4 may already be complete above 1800, with Wave 5 Grey advancing. A potential target is around 2090.

Invalidation point: 1523

Bajaj Finserve 4H Chart Technical Analysis and Elliott Wave Projections:

The 4H chart shows the wave progression since the completion of Intermediate Wave (4) Orange near the 1420 level. Notably, Minor Wave 2 Grey unfolded as an expanded flat, ending around 1525, while Minor Wave 3 rallied to highs of 1937.

If the wave count holds, we could see a decline into the 1770-1780 range before prices push higher towards the 2100 level, marking the completion of Wave 5 Grey. Moving forward, prices should remain above 1525.

Technical Analyst: Harsh Japee

Source: visit Tradinglounge.com and learn From the Experts Join TradingLounge Here 

Previous: DR REDDY'S LABORATORIES Elliott Wave Technical Analysis

VALUE Offer - Buy 1 Month & Get 3 Months!Click here

Access 7 Analysts Over 200 Markets Covered. Chat Room With Support

Bajaj-Finserve-4H-St...


Conclusion:

Bajaj Finserve is in the process of unfolding Minor Wave 4 Grey, potentially finding support around the 1770-1780 range before resuming its upward movement.

Related

Australian Dollar/U.S.Dollar (AUDUSD) Elliott Wave Technical Analysis 9 January 24

Australian Dollar/U.S.Dollar (AUDUSD) Elliott Wave Technical Analysis 9 January 24

AUDUSD Elliott Wave Analysis dated 9 January 24, provides a comprehensive analysis of the Australian...

Read More >
JP Morgan Chase & Co.(JPM:NYSE) Elliott Wave Technical Analysis 13 November 23

JP Morgan Chase & Co.(JPM:NYSE) Elliott Wave Technical Analysis 13 November 23

JP Morgan Chase & Co., Stock Market Analysis - Trading Lounge Elliott Wave Technical Analysis Chart ...

Read More >
Costco Wholesale Corp.(COST:NASDAQ) Elliott Wave Technical Analysis 7 November 23

Costco Wholesale Corp.(COST:NASDAQ) Elliott Wave Technical Analysis 7 November 23

Costco Wholesale Corp.(COST:NASDAQ) Elliott Wave Technical Analysis on 7 November 23, COST Stock Mar...

Read More >
DOTUSD Elliott Wave Analysis: Polkadot Crypto Price Predictions, Technical Indicators, and Enhance Your Trading Strategy

DOTUSD Elliott Wave Analysis: Polkadot Crypto Price Predictions, Technical Indicators, and Enhance Your Trading Strategy

This article provides a detailed Elliott Wave analysis of DOT/USD, offering insights into Polkadot’...

Read More >
The Walt Disney Co. (DIS) U.S. Stocks Elliott Wave Technical Analysis : DIS Approaching Wave (5) of C at $128 Resistance

The Walt Disney Co. (DIS) U.S. Stocks Elliott Wave Technical Analysis : DIS Approaching Wave (5) of C at $128 Resistance

Detailed Elliott Wave analysis on DIS shows a near-complete Wave (5) of corrective Wave C on the dai...

Read More >
XRP Elliott Wave USD Outlook: Wave 3 Momentum, Fibonacci Resistance, Swing Trade “Buy the Dip” Strategy, and Invalidation Watchpoint

XRP Elliott Wave USD Outlook: Wave 3 Momentum, Fibonacci Resistance, Swing Trade “Buy the Dip” Strategy, and Invalidation Watchpoint

Comprehensive XRPUSD Elliott Wave outlook—Wave 3 momentum, Fib resistance zones, “Buy the Dip” sw...

Read More >

$1 for 2 Weeks

then $29 a month!

What a Special Offer!

Trade Recommendations

Unleash the power of deversified trading with our comprehensive portfolio, covering 250+ markets:

  • Stock Trades
  • Crypto Trades
  • Forex Trades
  • Commodity Trades
Elliott Wave Analysis

Gain a competitive edge with expert insights and AI-powered Elliott Wave charting into:

  • Global Indices
  • US Stocks & ASX Stocks
  • Forex & Crypto
  • Commodities
Top-Notch Trading Tools

Equip yourself with the tools of success:

  • Real-time Chat rooms
  • Elliott Wave Algorithm
  • Portfolio tools
  • TradingLevels
  • Screener
  • Trading Game
7 Elliott Wave Analysts

Stay ahead of the market with daily charts and insightful videos
Your secret to strategic trading!

JOIN HERE


Welcome to TradingLounge (ASIC A.R.No. 321187), specialists in trades, trading education and technical analysis, covering stocks, indices, commodities, forex and cryptocurrencies.

When you join TradingLounge you have access to everything we offer, including trade tools, educational content and a social platform to chat with like-minded investors.

Read more

@Copyright 2024 by tradinglounge.com

Contact Us

Australian no: 02 4787 6020

International no: +61 (2) 47876020

Pay with:

Find us on