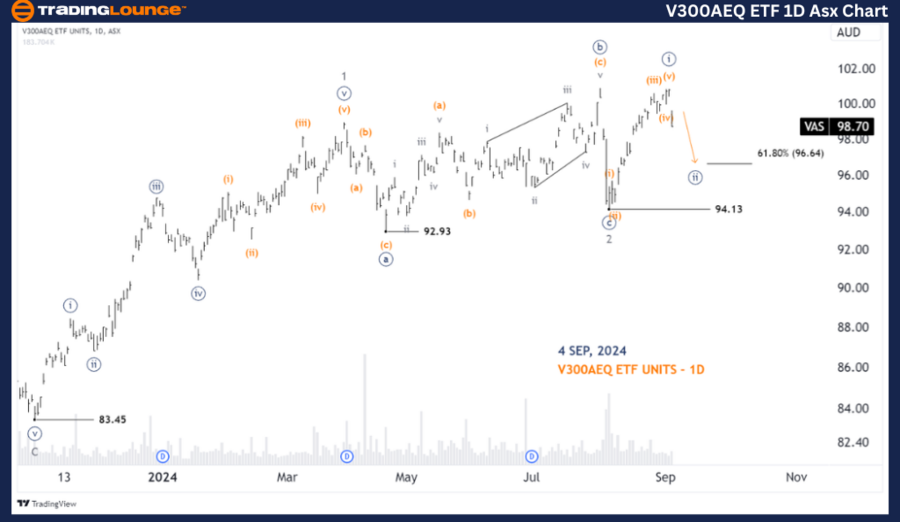
ASX: V300AEQ ETF UNITS – VAS Elliott Wave Analysis TradingLounge (1D Chart)

Greetings, this Elliott Wave analysis offers an updated view of the Australian Stock Exchange (ASX) focusing on V300AEQ ETF UNITS – VAS. According to our assessment, VAS may have completed wave 2-grey, with wave 3-grey currently unfolding, indicating a potential upward trend.

ASX: V300AEQ ETF UNITS – VAS 1D Chart (Semilog Scale) Analysis

Vanguard Australian shares Index – VAS Elliott Wave Technical Analysis

Function: Major trend (Minor degree, grey)

Mode: Motive

Structure: Impulse

Position: Wave ((ii))-navy of Wave 3-grey

Details: Wave ((ii))-navy appears to be pushing slightly lower, targeting a low around 96.64 or possibly lower. Following this, wave ((iii))-navy could push the price higher. A Long Trade Setup will be considered at the Major Level of 100.00.

Invalidation Point: 94.13

V300AEQ-ETF-1D-Asx-C...


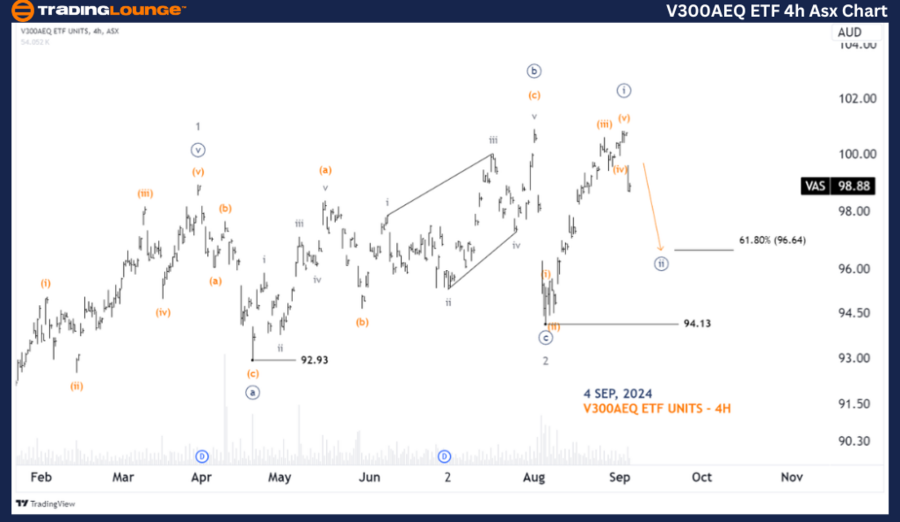
ASX: V300AEQ ETF UNITS – VAS Elliott Wave  Analysis TradingLounge (4-Hour Chart)

Vanguard Australian shares Index

Function: Major trend (Minute degree, navy)

Mode: Motive

Structure: Impulse

Position: Wave ((ii))-navy

Details: Wave ((i))-navy has completed as a five-wave structure starting from 94.13. Currently, wave ((ii))-orange is unfolding and may push slightly lower, targeting around 96.64. Afterward, we will look for a Long Trade Setup for a return in wave ((iii))-navy.

Invalidation Point: 94.13

Technical Analyst: Hua (Shane) Cuong, CEWA-M (Master’s Designation).

Source: visit Tradinglounge.com and learn From the Experts Join TradingLounge Here 

See Previous: News Corporation - NWS Elliott Wave Technical Analysis

Special Trial Offer - 0.76 Cents a Day for 3 Months! Click here

Access 7 Analysts Over 200 Markets Covered. Chat Room With Support

V300AEQ-ETF-4h-Asx-C...

Conclusion:

Our analysis of ASX: V300AEQ ETF UNITS – VAS delivers insights into the market's trends, providing clear entry and exit points to maximize potential gains. By identifying key price levels for validation or invalidation, we enhance confidence in our Elliott Wave count. This approach helps investors to make informed decisions based on objective market forecasts and professional technical analysis.

Related

Currency Pair USDCHF Market Movements: U.S.Dollar/Swiss Franc Forex USDCHF Elliott Wave Technical Analysis

Currency Pair USDCHF Market Movements: U.S.Dollar/Swiss Franc Forex USDCHF Elliott Wave Technical Analysis

This analysis provides comprehensive insights into USDCHF using Elliott Wave theory. Covering both d...

Read More >
AUDUSD Continues to Display a Strong Bearish Trend in Australian Dollar/U.S. Dollar Forex Elliott Wave Technical Analysis

AUDUSD Continues to Display a Strong Bearish Trend in Australian Dollar/U.S. Dollar Forex Elliott Wave Technical Analysis

The AUDUSD continues to display a strong bearish trend in Elliott Wave analysis, with a key focus on...

Read More >
Capitalize on the Ongoing Trends in the NZDUSD Currency Pair: New Zealand Dollar/ U.S. Dollar Elliott Wave Technical Analysis

Capitalize on the Ongoing Trends in the NZDUSD Currency Pair: New Zealand Dollar/ U.S. Dollar Elliott Wave Technical Analysis

Delve into our comprehensive NZDUSD Elliott Wave analysis, focusing on both daily and 4-hour charts....

Read More >
Gold (XAUUSD) Elliott Wave Technical Analysis: Commodity Market Forecast, Trading Strategy, and Price Prediction

Gold (XAUUSD) Elliott Wave Technical Analysis: Commodity Market Forecast, Trading Strategy, and Price Prediction

This article provides an in-depth Elliott Wave analysis of gold, covering the latest price forecast,...

Read More >
Berkshire Hathaway (BRK.B) Elliott Wave Analysis: Stock Forecast, ZigZag Correction, Triangle Formation & Technical Outlook

Berkshire Hathaway (BRK.B) Elliott Wave Analysis: Stock Forecast, ZigZag Correction, Triangle Formation & Technical Outlook

Elliott Wave analysis of Berkshire Hathaway Inc. (BRK.B), focusing on a corrective zigzag structure ...

Read More >
Copper Commodity-Elliott Wave Analysis: Highlights Recent Price Movements, Long-term Trends, and Key Chart Patterns

Copper Commodity-Elliott Wave Analysis: Highlights Recent Price Movements, Long-term Trends, and Key Chart Patterns

This comprehensive Copper Elliott Wave analysis highlights recent price movements, long-term trends,...

Read More >

$1 for 2 Weeks

then $29 a month!

What a Special Offer!

Trade Recommendations

Unleash the power of deversified trading with our comprehensive portfolio, covering 250+ markets:

  • Stock Trades
  • Crypto Trades
  • Forex Trades
  • Commodity Trades
Elliott Wave Analysis

Gain a competitive edge with expert insights and AI-powered Elliott Wave charting into:

  • Global Indices
  • US Stocks & ASX Stocks
  • Forex & Crypto
  • Commodities
Top-Notch Trading Tools

Equip yourself with the tools of success:

  • Real-time Chat rooms
  • Elliott Wave Algorithm
  • Portfolio tools
  • TradingLevels
  • Screener
  • Trading Game
7 Elliott Wave Analysts

Stay ahead of the market with daily charts and insightful videos
Your secret to strategic trading!

JOIN HERE


Welcome to TradingLounge (ASIC A.R.No. 321187), specialists in trades, trading education and technical analysis, covering stocks, indices, commodities, forex and cryptocurrencies.

When you join TradingLounge you have access to everything we offer, including trade tools, educational content and a social platform to chat with like-minded investors.

Read more

@Copyright 2024 by tradinglounge.com

Contact Us

Australian no: 02 4787 6020

International no: +61 (2) 47876020

Pay with:

Find us on