Elliott Wave Analysis of Dogecoin/USD (DOGEUSD): A Comprehensive Guide

Daily Analysis of DOGEUSD with Elliott Wave Principles

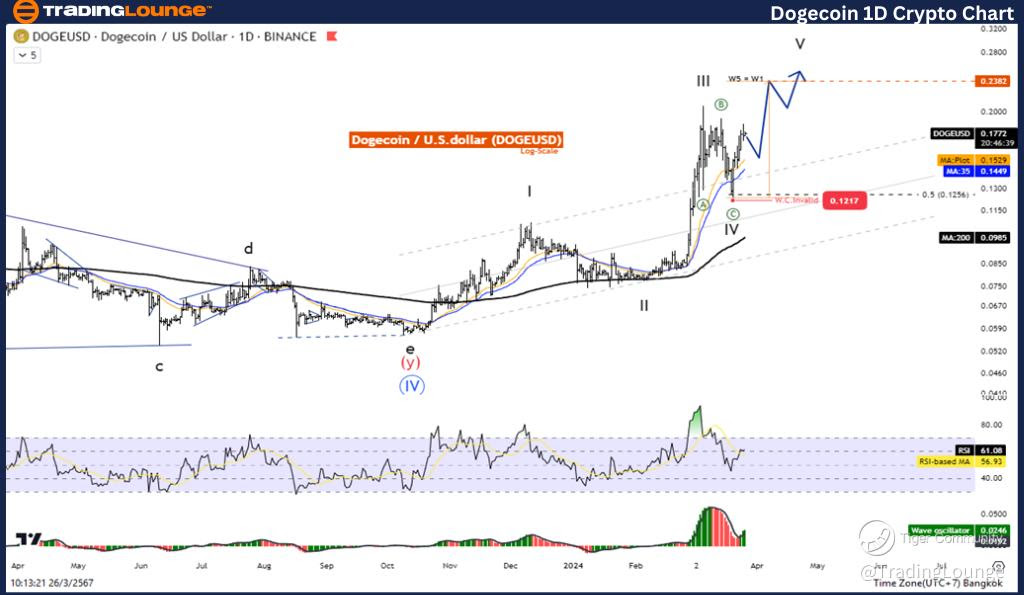
Dogecoin/ U.S. dollar(DOGEUSD) Daily Chart Analysis

DOGEUSD Elliott Wave Technical Analysis

The Essence of Current Trends:

  • Approach: Trend-Following
  • Behaviour: Progressive
  • Pattern: Impulse Wave
  • Current Phase: Wave ((5))
  • Future Trajectory: Anticipating wave V of the Impulse Sequence
  • Critical Threshold for Validation: Specific level undisclosed

In-Depth Insight: The unfolding of Wave ((5)), mirroring the magnitude of Wave ((1)), marks a pivotal juncture at the 0.2182 price point.

Strategic Perspective on DOGEUSD Trading:

The conclusion of Wave IV's correction phase sets the stage for a resurgence in Wave V. Given the historical pattern, where Wave V mirrors Wave I in length, our projections suggest a potential rally towards the 0.2382 threshold before the next corrective cycle.

Technical Indicators Overview:

The positioning above the 200-day moving average (MA200) signals a bullish trend, corroborated by positive momentum on the Wave Oscillator.

DOGEUSD-day-crypto-c...


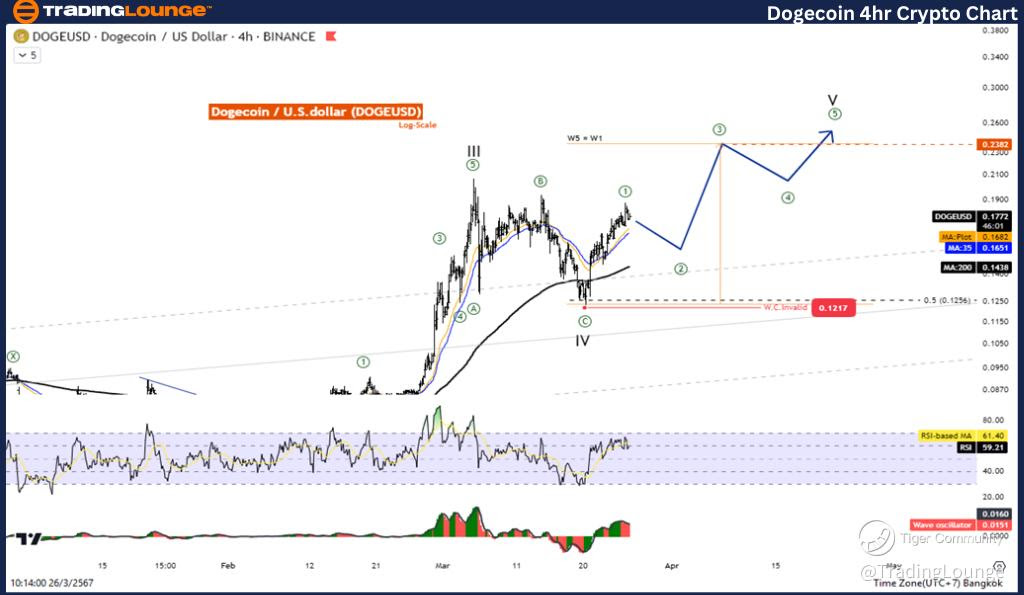
Elliott Wave Forecast on the 4-Hour Chart for Dogecoin/USD (DOGEUSD)

Dogecoin/ U.S. dollar(DOGEUSD) 4-Hour Chart Analysis

Elliott Wave Technical Analysis for DOGEUSD

Technical Analysis Fundamentals:

  • Function: Follow trend
  • Mode: Motive
  • Structure: Impulse
  • Position: Wave ((5))
  • Direction Next higher Degrees: wave V of Impulse
  • Wave Cancel invalid Level:
  • Analytical Details: Wave ((5)) is highlighted as a critical phase, precisely aligning with Wave ((1)) at the 0.2182 mark, underscoring its significance.

Trading Insights for DOGEUSD:

The transition from the corrective dynamics of Wave IV to the bullish momentum of Wave V is evident. With Wave V expected to emulate the length of Wave I, the anticipation of reaching the 0.2382 level before the ensuing correction is high.

Technical Indicators Summary:

The bullish trend is confirmed by the asset's performance above the MA200, with the Wave Oscillator further indicating bullish momentum.

This analysis, structured to offer a clear and methodical breakdown of DOGEUSD's potential movements through Elliott Wave Theory, aims to provide traders and investors with a strategic edge in navigating the volatile cryptocurrency market. By understanding the key phases and indicators, stakeholders can make informed decisions, leveraging the predictive power of Elliott Wave Analysis to optimize their trading strategies.

Technical Analyst: Kittiampon Somboonsod, CEWA

Source: visit Tradinglounge.com and learn From the Experts Join TradingLounge Here 

See Previous: Ethereum/ U.S. dollar(ETHUSD)

TradingLounge Once Off SPECIAL DEAL: Here > 1 month Get 3 months.

DOGEUSD-4Hr-crypto-c...

Related

Swiss Market Index (SMI) Elliott Wave Analysis – Bullish Trend, Forecast, Technical Chart, Price Prediction, and Stock Market Outlook

Swiss Market Index (SMI) Elliott Wave Analysis – Bullish Trend, Forecast, Technical Chart, Price Prediction, and Stock Market Outlook

The Swiss Market Index (SMI) continues its bullish Elliott Wave trend, with impulsive wave formation...

Read More >
Maximize Gains with Expert NASDAQ Elliott Wave Analysis and Trading Strategies

Maximize Gains with Expert NASDAQ Elliott Wave Analysis and Trading Strategies

Explore our expert Elliott Wave Analysis and trading strategies for NASDAQ 100 (NDX) and leading tec...

Read More >
Anticipated Forex Market Shifts: British Pound/U.S. Dollar Currency Pair and GBPUSD Elliott Wave Technical Analysis

Anticipated Forex Market Shifts: British Pound/U.S. Dollar Currency Pair and GBPUSD Elliott Wave Technical Analysis

This comprehensive GBPUSD Elliott Wave analysis delves into the bearish trend on daily and 4-hour ch...

Read More >
Exxon Mobil Corp.(XOM:NYSE) Elliott Wave Technical Analysis 24 October 23

Exxon Mobil Corp.(XOM:NYSE) Elliott Wave Technical Analysis 24 October 23

Exxon Mobil Corp.(XOM: NYSE) Elliott Wave Technical Analysis 4-hour chart and 1-hour chart for 24 Oc...

Read More >
Ethereum Elliott Wave Technical Analysis Identifies ETHUSD Reversal Zone Using Fibonacci Levels and Trading Strategy

Ethereum Elliott Wave Technical Analysis Identifies ETHUSD Reversal Zone Using Fibonacci Levels and Trading Strategy

Ethereum Elliott Wave analysis shows wave C nearing completion, targeting the $1,230–$1,250 range. ...

Read More >

$1 for 2 Weeks

then $29 a month!

What a Special Offer!

Trade Recommendations

Unleash the power of deversified trading with our comprehensive portfolio, covering 250+ markets:

  • Stock Trades
  • Crypto Trades
  • Forex Trades
  • Commodity Trades
Elliott Wave Analysis

Gain a competitive edge with expert insights and AI-powered Elliott Wave charting into:

  • Global Indices
  • US Stocks & ASX Stocks
  • Forex & Crypto
  • Commodities
Top-Notch Trading Tools

Equip yourself with the tools of success:

  • Real-time Chat rooms
  • Elliott Wave Algorithm
  • Portfolio tools
  • TradingLevels
  • Screener
  • Trading Game
7 Elliott Wave Analysts

Stay ahead of the market with daily charts and insightful videos
Your secret to strategic trading!

JOIN HERE


Welcome to TradingLounge (ASIC A.R.No. 321187), specialists in trades, trading education and technical analysis, covering stocks, indices, commodities, forex and cryptocurrencies.

When you join TradingLounge you have access to everything we offer, including trade tools, educational content and a social platform to chat with like-minded investors.

Read more

@Copyright 2024 by tradinglounge.com

Contact Us

Australian no: 02 4787 6020

International no: +61 (2) 47876020

Pay with:

Find us on