27Jun

U.S. Dollar / Japanese Yen (USDJPY) Elliott Wave Analysis: Bearish Forecast as Impulsive Wave 3 Unfolds Below Key Invalidation Level of 148.105

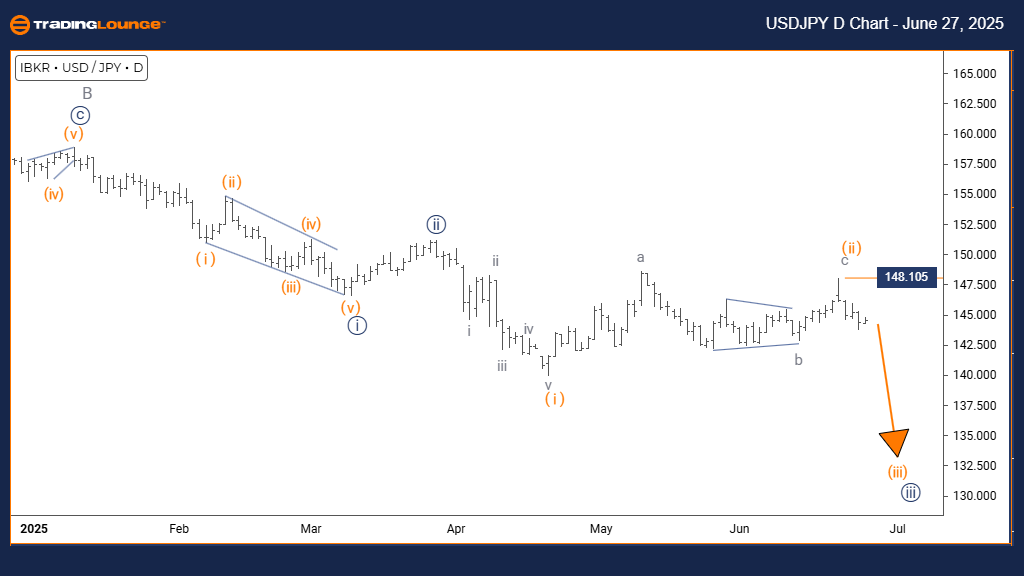
U.S. Dollar / Japanese Yen (USDJPY) Elliott Wave Analysis – Trading Lounge Daily Chart

USDJPY Elliott Wave Technical Forecast

FUNCTION: Bearish Market Structure

MODE: Impulsive Decline

STRUCTURE: Developing Orange Wave 3

POSITION: Initial Phase of Navy Blue Wave 1

DIRECTION OF NEXT SUB-WAVES: Continuation of Orange Wave 3

DETAILS: Completion of Orange Wave 2 confirmed; Orange Wave 3 in progress

WAVE INVALIDATION LEVEL: 148.105

The daily USDJPY Elliott Wave analysis signals a sustained bearish trend. The currency pair is following an impulsive decline, characteristic of strong downside momentum. Currently, the pattern is forming Orange Wave 3, situated within a larger Navy Blue Wave 1 context—indicating the early stage of a broader downward cycle.

Orange Wave 2 appears concluded, with Orange Wave 3 now active. As the most dynamic part of an Elliott Wave bearish sequence, Wave 3 typically generates significant price declines. Traders should expect accelerated downward movement if the structure maintains its integrity.

The critical level to monitor remains at 148.105. A break above this threshold would invalidate the existing wave count and demand a structural review. While USDJPY stays below this level, bearish momentum is likely to persist.

Current technical indicators reinforce the bearish USDJPY outlook. With institutional selling pressure evident, the continuation of Orange Wave 3 aligns with forecasts of stronger downside movement in the ongoing Navy Blue Wave 1 development.

USDJPY-D-FOREX-CHART...


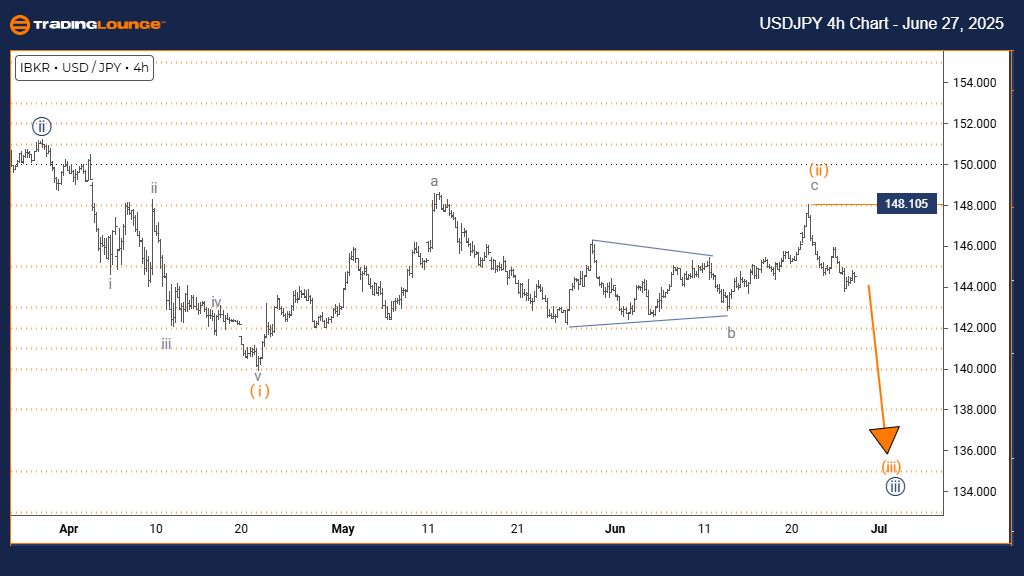
U.S. Dollar / Japanese Yen (USDJPY) Elliott Wave Analysis – Trading Lounge 4-Hour Chart

USDJPY Elliott Wave Technical Forecast

FUNCTION: Bearish Trend Continuation

MODE: Impulsive Price Action

STRUCTURE: Orange Wave 3 Formation

POSITION: Within Navy Blue Wave 1

DIRECTION OF NEXT SUB-WAVES: Orange Wave 3 Ongoing

DETAILS: Orange Wave 2 completed; Orange Wave 3 initiated

WAVE INVALIDATION LEVEL: 148.105

The 4-hour USDJPY Elliott Wave forecast continues to emphasize bearish conditions. The pair is actively moving through Orange Wave 3, a strong impulsive leg within the broader Navy Blue Wave 1 trend. This setup signals robust downward movement consistent with Wave 3 characteristics.

With the conclusion of Orange Wave 2, the transition to Wave 3 has started. Elliott Wave theory suggests that Wave 3 often results in sharp price drops with limited corrective activity. As this structure develops, traders should closely monitor its progression for trend confirmation.

The 148.105 level remains a key invalidation point. Any sustained move above this line will negate the current bearish wave count. As long as the price holds beneath it, the bearish structure remains in play.

Technical momentum indicators support the likelihood of deeper declines in USDJPY. With Orange Wave 3 extending, the market setup favors continued selling pressure and additional downside over the short term.

Technical Analyst: Malik Awais

Source: Visit Tradinglounge.com and learn from the Experts. Join TradingLounge Here

Previous: EURUSD Elliott Wave Technical Analysis

VALUE Offer - Buy 1 Month & Get 3 Months!Click here

Access 7 Analysts Over 200 Markets Covered. Chat Room With Support

USDJPY-4H-FOREX-CHAR...

Related

Netflix Inc. (NFLX) Stock Analysis: An Elliottwave Technical analysis Perspective

Netflix Inc. (NFLX) Stock Analysis: An Elliottwave Technical analysis Perspective

This article provides an in-depth Elliott Wave analysis of Netflix Inc. (NFLX) stock, offering a det...

Read More >
Texas Instruments Inc.,  (TXN) Elliott Wave Technical  Analysis: Potential Upside Momentum Signals on Daily and 4-Hour Charts.

Texas Instruments Inc.,  (TXN) Elliott Wave Technical Analysis: Potential Upside Momentum Signals on Daily and 4-Hour Charts.

Dive into Elliott Wave analysis for Texas Instruments Inc. (TXN) unveiling potential upward trends o...

Read More >
NIFTY 50 Elliott Wave Technical Analysis: Expanded Flat Correction Nears 25,000-25,100, Key Support at 22,700

NIFTY 50 Elliott Wave Technical Analysis: Expanded Flat Correction Nears 25,000-25,100, Key Support at 22,700

The NIFTY 50 Index is currently in a corrective wave phase, moving towards 25,000-25,100 as part of ...

Read More >
FTSE 100 (UK)  Elliott Wave Analysis: Insights on Bullish Trends, Orange Wave 5, Navy Blue Wave 3, and Invalidation Levels

FTSE 100 (UK) Elliott Wave Analysis: Insights on Bullish Trends, Orange Wave 5, Navy Blue Wave 3, and Invalidation Levels

Elliott Wave Analysis of the FTSE 100 index, highlighting bullish trends in both daily and weekly ch...

Read More >
AUDJPY Elliott Wave Technical Analysis: Trading Signals, Support & Resistance Levels, and Price Predictions for Forex Traders

AUDJPY Elliott Wave Technical Analysis: Trading Signals, Support & Resistance Levels, and Price Predictions for Forex Traders

AUDJPY technical analysis explores the current market trend using Elliott Wave principles. It covers...

Read More >
Tech Mahindra Stocks Elliott Wave Technical Analysis: Insights into Potential Stock Movements and Price Predictions

Tech Mahindra Stocks Elliott Wave Technical Analysis: Insights into Potential Stock Movements and Price Predictions

This article provides a comprehensive Elliott Wave analysis of Tech Mahindra, offering insights into...

Read More >

$1 for 2 Weeks

then $29 a month!

What a Special Offer!

Trade Recommendations

Unleash the power of deversified trading with our comprehensive portfolio, covering 250+ markets:

  • Stock Trades
  • Crypto Trades
  • Forex Trades
  • Commodity Trades
Elliott Wave Analysis

Gain a competitive edge with expert insights and AI-powered Elliott Wave charting into:

  • Global Indices
  • US Stocks & ASX Stocks
  • Forex & Crypto
  • Commodities
Top-Notch Trading Tools

Equip yourself with the tools of success:

  • Real-time Chat rooms
  • Elliott Wave Algorithm
  • Portfolio tools
  • TradingLevels
  • Screener
  • Trading Game
7 Elliott Wave Analysts

Stay ahead of the market with daily charts and insightful videos
Your secret to strategic trading!

JOIN HERE


Welcome to TradingLounge (ASIC A.R.No. 321187), specialists in trades, trading education and technical analysis, covering stocks, indices, commodities, forex and cryptocurrencies.

When you join TradingLounge you have access to everything we offer, including trade tools, educational content and a social platform to chat with like-minded investors.

Read more

@Copyright 2024 by tradinglounge.com

Contact Us

Australian no: 02 4787 6020

International no: +61 (2) 47876020

Pay with:

Find us on