07Mar

McDonald’s Corp.(MCD) Elliott Wave Technical Analysis: Unveiling Trading Opportunities

Unlocking insights into the market dynamics of McDonald’s Corp. (MCD) through Elliott Wave Analysis reveals promising trading opportunities. This comprehensive analysis delves into both daily and 4-hour charts to provide a strategic outlook for traders.

MCD Elliott Wave Analysis Trading Lounge Daily Chart

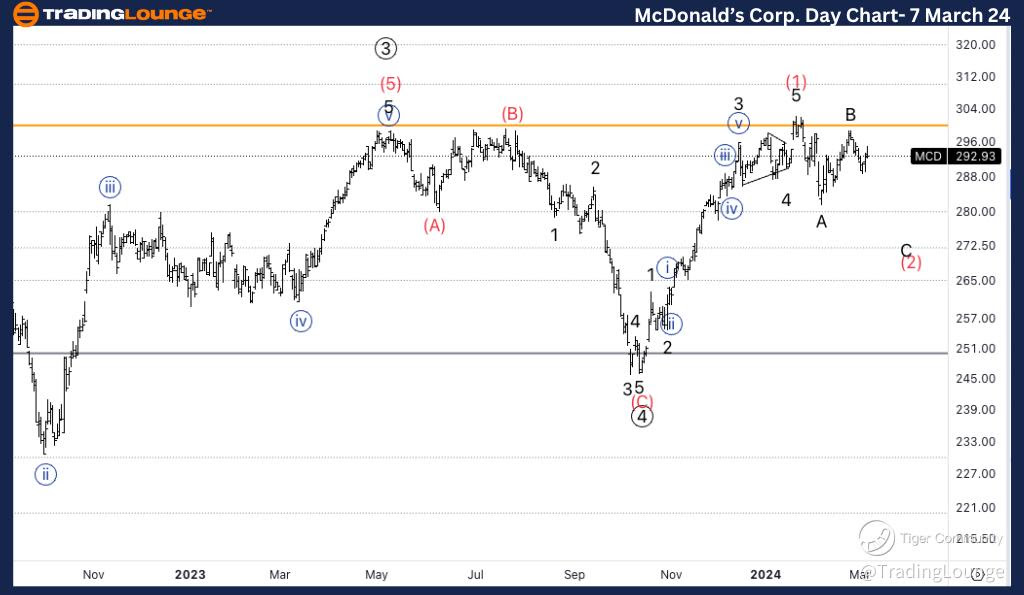
McDonald’s Corp., (MCD) Daily Chart Analysis

MCD Elliott Wave Technical Analysis

Function: Trend

Mode: Motive

Structure: Impulsive

Position: Intermediate wave (2)

Direction: Completion of wave C of (2)

In the daily chart analysis of McDonald’s Corp. (MCD), we observe a compelling trend characterized by its impulsive nature. Currently positioned within the intermediate wave (2), the completion of wave C signals a pivotal juncture. Notably, the breach of the previous All-Time High (ATH) at $300 is indicative of bullish momentum. However, the resistance encountered at TL3 necessitates a potential pullback before the upward trajectory resumes.

MCD-day-stock-chart-...


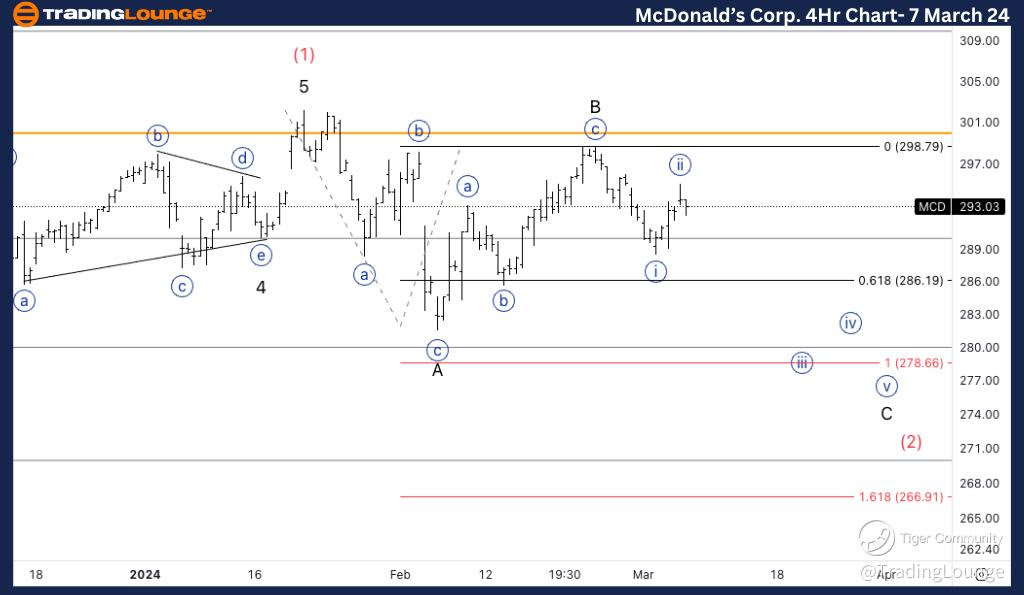
MCD Elliott Wave Analysis Trading Lounge 4Hr Chart, 7 March 24

McDonald’s Corp., (MCD) 4Hr Chart Analysis

MCD Elliott Wave Technical Analysis

Function: Counter Trend

Mode: Corrective

Structure: Flat

Position: Wave {ii} of C

Direction: Acceleration lower into wave {iii}

Analyzing the 4-hour chart of McDonald’s Corp. (MCD) unveils counter-trend movements typified by corrective waves. Positioned within the flat structure, wave {ii} of C showcases a potential deceleration. Anticipating acceleration lower into wave {iii} remains a key focus. However, the possibility of a sideways wave B formation cannot be discounted entirely. Notably, the equality of C versus A points towards a target slightly below $278, aligning with wave C's trajectory.

Leveraging Elliott Wave Analysis for Strategic Trading

By leveraging Elliott Wave Analysis, traders can gain valuable insights into market trends and capitalize on potential trading opportunities. The combination of motive and corrective modes, along with impulsive and flat structures, offers a nuanced understanding of market dynamics. Identifying intermediate waves and anticipating directional shifts enable traders to make informed decisions, optimizing their trading strategies for success.

Conclusion

In conclusion, McDonald’s Corp. (MCD) presents a compelling landscape for traders, as depicted through Elliott Wave Analysis. The daily chart signals bullish momentum, with potential pullbacks offering entry points for long positions. Meanwhile, the 4-hour chart highlights counter-trend movements, urging caution and strategic positioning. By embracing Elliott Wave principles, traders can navigate the complexities of the market with confidence, unlocking profitable opportunities along the way.

Technical Analyst: Alessio Barretta

Source: visit Tradinglounge.com and learn From the Experts Join TradingLounge Here 

See Previous: The Coca-Cola Company (KO)

TradingLounge Once Off SPECIAL DEAL: Here > 1 month Get 3 months.   

MCD-4Hr-stock-chart-...

Related

Wheat Price Forecast 2025: Wheat Commodity Elliott Wave Signals End of Bearish Cycle with Support Near $500 for Trend Reversal

Wheat Price Forecast 2025: Wheat Commodity Elliott Wave Signals End of Bearish Cycle with Support Near $500 for Trend Reversal

Wheat futures remain bearish, but Elliott Wave analysis signals a potential reversal near $500 as an...

Read More >
Bitcoin Crypto Price News Elliott Wave Technical Analysis: BTCUSD Forecasting Potential Uptrends, and Trading Strategies

Bitcoin Crypto Price News Elliott Wave Technical Analysis: BTCUSD Forecasting Potential Uptrends, and Trading Strategies

This article provides a comprehensive BTCUSD Elliott Wave analysis, Highlighting Bitcoin's curre...

Read More >
Elliott Wave Analysis of SGX TSI Iron Ore Futures: Unveiling Commodity Market Trends, Price Forecasts, and Trading Strategies

Elliott Wave Analysis of SGX TSI Iron Ore Futures: Unveiling Commodity Market Trends, Price Forecasts, and Trading Strategies

This article provides a detailed Elliott Wave analysis of the SGX TSI Iron Ore Futures, highlighting...

Read More >
Natural Gas Commodity Market Outlook: Experiencing a Bearish Trend According to Elliott Wave Technical Analysis

Natural Gas Commodity Market Outlook: Experiencing a Bearish Trend According to Elliott Wave Technical Analysis

Natural Gas is experiencing a bearish trend according to Elliott Wave analysis, with further downsid...

Read More >
Polkadot/U.S. dollar(DOTUSD) Elliott Wave Technical Analysis 1 February 24

Polkadot/U.S. dollar(DOTUSD) Elliott Wave Technical Analysis 1 February 24

TradingLounge Polkadot technical analysis today using Polkadot/US dollar(DOTUSD) Elliott Wave Analys...

Read More >

$1 for 2 Weeks

then $29 a month!

What a Special Offer!

Trade Recommendations

Unleash the power of deversified trading with our comprehensive portfolio, covering 250+ markets:

  • Stock Trades
  • Crypto Trades
  • Forex Trades
  • Commodity Trades
Elliott Wave Analysis

Gain a competitive edge with expert insights and AI-powered Elliott Wave charting into:

  • Global Indices
  • US Stocks & ASX Stocks
  • Forex & Crypto
  • Commodities
Top-Notch Trading Tools

Equip yourself with the tools of success:

  • Real-time Chat rooms
  • Elliott Wave Algorithm
  • Portfolio tools
  • TradingLevels
  • Screener
  • Trading Game
7 Elliott Wave Analysts

Stay ahead of the market with daily charts and insightful videos
Your secret to strategic trading!

JOIN HERE


Welcome to TradingLounge (ASIC A.R.No. 321187), specialists in trades, trading education and technical analysis, covering stocks, indices, commodities, forex and cryptocurrencies.

When you join TradingLounge you have access to everything we offer, including trade tools, educational content and a social platform to chat with like-minded investors.

Read more

@Copyright 2024 by tradinglounge.com

Contact Us

Australian no: 02 4787 6020

International no: +61 (2) 47876020

Pay with:

Find us on