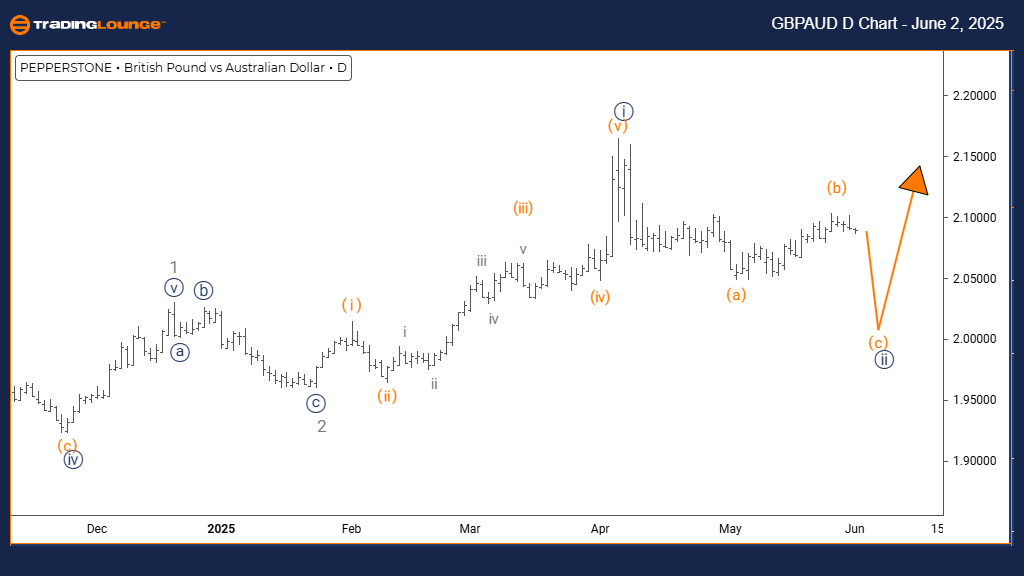
GBPAUD Elliott Wave Analysis – Trading Lounge Daily Chart
British Pound / Australian Dollar (GBPAUD) – Daily Chart Analysis
GBPAUD Elliott Wave Technical Overview
Function: Counter-Trend
Mode: Corrective
Structure: Navy Blue Wave 2
Position: Gray Wave 3
Next Higher Degree Direction: Navy Blue Wave 3
Details: Completion of Navy Blue Wave 1 confirmed; Navy Blue Wave 2 currently progressing.
Current Technical View
The daily chart of GBPAUD shows a corrective pullback within a dominant bullish trend. Navy Blue Wave 2 is unfolding after Navy Blue Wave 1 concluded, indicating the pair is now within Gray Wave 3. This pattern suggests a short-term consolidation before the uptrend likely resumes.
Corrective Phase and Market Implications
Technical analysis confirms the end of Navy Blue Wave 1 and highlights the ongoing development of Navy Blue Wave 2. This correction points to limited downside risk. As long as major support holds, GBPAUD is expected to resume its upward trajectory in Navy Blue Wave 3. This wave count helps traders align with the prevailing trend.
Trader Guidance and Market Forecast
During the progression of Navy Blue Wave 2, market volatility may increase. This phase reflects a pause in the larger bullish cycle. Traders should watch for signs of the correction ending, which may trigger Navy Blue Wave 3’s rally. The current Elliott Wave structure offers a framework for understanding both short-term retracement and long-term bullish continuation.
Staying alert to emerging wave patterns is essential for anticipating the pair’s next move. Use strict risk management, as wave patterns evolve. This decline remains corrective—not the start of a bearish reversal—hinting at renewed upside once Wave 2 finalizes.
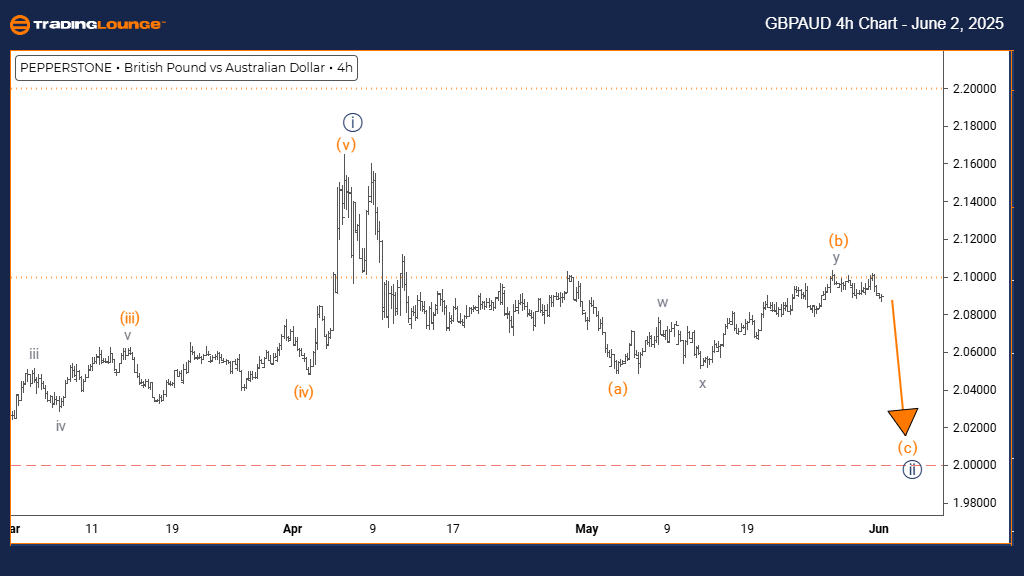
British Pound / Australian Dollar (GBPAUD) Forex – Tradinglounge 4-Hour Chart
GBPAUD Elliott Wave Technical Overview
Function: Counter-Trend
Mode: Impulsive
Structure: Orange Wave C
Position: Navy Blue Wave 2
Next Higher Degree Direction: Navy Blue Wave 3
Details: Orange Wave B appears completed; Orange Wave C of 2 is forming now.
Current Market Scenario
The 4-hour GBPAUD chart illustrates an impulsive move within a larger corrective setup. Orange Wave C is forming within Navy Blue Wave 2, marking the conclusion of Orange Wave B. This final leg in the correction suggests continued downward pressure in the near term.
Technical Implications and Market Behaviour
The shift from Orange Wave B to C introduces short-term bearish action within a broader correction. The impulsive nature of Wave C points to immediate weakness, but the structure still aligns with a larger bullish trend. Traders should recognize that this is a correction phase, not the onset of a long-term downtrend.
Outlook and Trading Strategy
Wave C’s development indicates temporary weakness, but once it completes, Navy Blue Wave 2 should conclude, setting up for a new upward phase. Traders should monitor support zones and reversal signals to prepare for the transition into Navy Blue Wave 3.
This analysis delivers key insights for forex traders managing trades during corrective waves. While price is currently declining, the structure supports a bullish reversal post-correction. Emphasis should be placed on strategic entries and strong risk controls in this evolving wave environment.
Technical Analyst: Malik Awais
Source: Visit Tradinglounge.com and learn from the Experts. Join TradingLounge Here
Previous: NZDUSD Elliott Wave Technical Analysis
VALUE Offer - Buy 1 Month & Get 3 Months!Click here
Access 7 Analysts Over 200 Markets Covered. Chat Room With Support