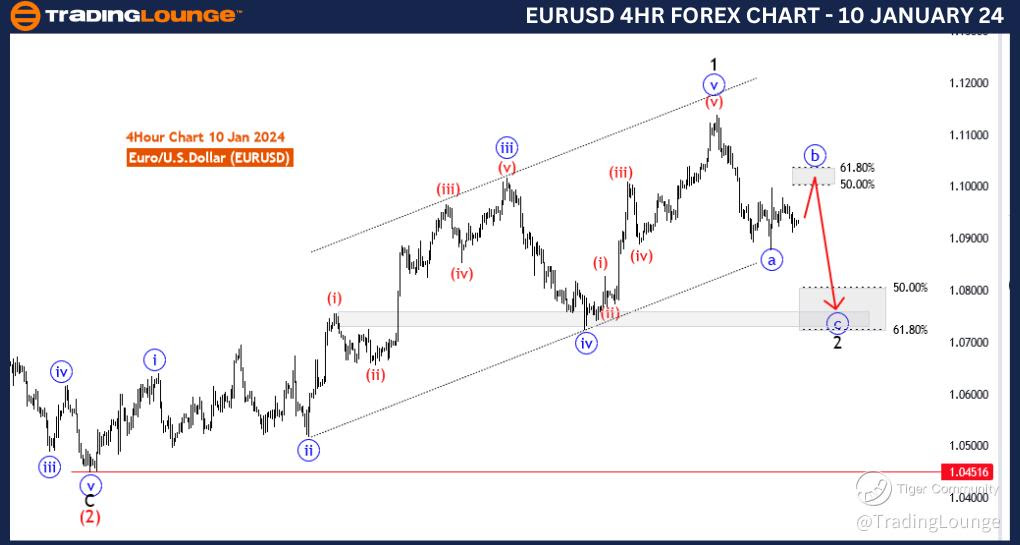
EURUSD Elliott Wave Analysis Trading Lounge 4 Hour Chart, 10 January 24
Euro/U.S.Dollar(EURUSD) 4 Hour Chart
EURUSD Elliott Wave Technical Analysis
Function: Trend
Mode: Corrective
Structure: likely Zigzag in black wave 2
Position: Red wave 3
Direction Next Higher Degrees: black wave 3
Details: blue wave 5 of 1 completed at 1.11403 .Now black wave 2 is in play . Wave Cancel invalid level: 1.04516
The "EURUSD Elliott Wave Analysis Trading Lounge 4 Hour Chart" dated 10 January 24, delves into the intricacies of the Euro/U.S. Dollar (EURUSD) currency pair, utilizing Elliott Wave theory to provide traders with valuable insights.
The identified "Function" is characterized as "Trend," indicating a focus on understanding the current trend in the market. This suggests an inclination toward positioning the ongoing price movements within the broader trend context.
The specified "Mode" is labeled as "Corrective," signaling that the market is currently in a corrective phase. Corrective phases involve price movements against the prevailing trend, often characterized by temporary interruptions or reversals.
The primary "Structure" is described as a "likely Zigzag in black wave 2." This implies that the corrective pattern unfolding in the market is potentially following a Zigzag structure within the broader Elliott Wave count of black wave 2. Recognizing this corrective structure is crucial for traders to anticipate potential price movements.
The identified "Position" is labeled as "Red wave 3," providing insights into the current position of the market within the broader Elliott Wave sequence. This information is essential for traders to comprehend the context of the correction within the overall trend.
In terms of "Direction Next Higher Degrees," the analysis points to the anticipated "black wave 3." This indicates that, following the completion of the current corrective wave (likely Zigzag) labeled as black wave 2, the market is expected to resume its upward direction as part of the broader trend.
The "Details" section mentions that "blue wave 5 of 1" has been completed at 1.11403, signaling the conclusion of the preceding impulsive wave. The market is currently engaged in a corrective phase labeled as "black wave 2," providing traders with a reference point for their analysis.
The "Wave Cancel invalid level" is identified as "1.04516," indicating that if the market reaches this level, the current wave count would be invalidated. Traders may need to reassess their analysis in such a scenario.
In summary, the EURUSD Elliott Wave Analysis for the 4 Hour Chart on 10 January 24, suggests that the market is currently in a corrective phase, potentially following a Zigzag structure within black wave 2. Traders are advised to monitor the completion of this correction and be prepared for a potential continuation of the upward trend in black wave 3. The invalidation level at 1.04516 provides a critical point for assessing the accuracy of the Elliott Wave count.
Technical Analyst: Malik Awais
Source: Tradinglounge.com get trial here!
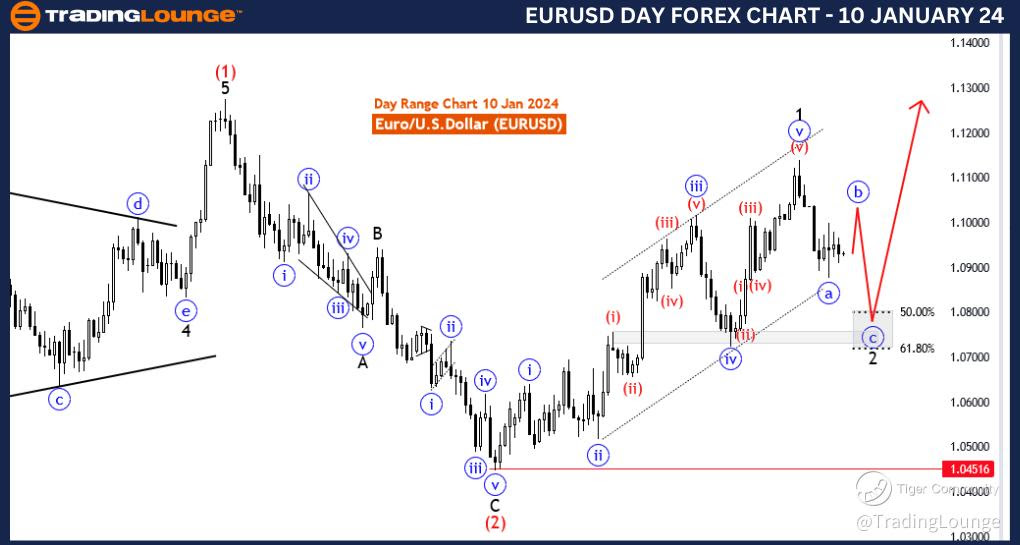
EURUSD Elliott Wave Analysis Trading Lounge Day Chart, 10 January 24
Euro/U.S.Dollar(EURUSD) Day Chart
EURUSD Elliott Wave Technical Analysis
Function: Trend
Mode: Corrective
Structure: likely Zigzag in black wave 2
Position: Red wave 3
Direction Next Higher Degrees: black wave 3
Details: blue wave 5 of 1 completed at 1.11403 .Now black wave 2 is in play . Wave Cancel invalid level: 1.04516
The "EURUSD Elliott Wave Analysis Trading Lounge Day Chart" for 10 January 24, provides a comprehensive examination of the Euro/U.S. Dollar (EURUSD) currency pair using Elliott Wave theory, offering traders valuable insights for their market analysis.
The identified "Function" is characterized as "Trend," indicating a focus on understanding the current trend in the market. This suggests an inclination toward positioning the ongoing price movements within the broader trend context.
The specified "Mode" is labeled as "Corrective," signaling that the market is currently in a corrective phase. Corrective phases involve price movements against the prevailing trend, often characterized by temporary interruptions or reversals.
The primary "Structure" is described as a "likely Zigzag in black wave 2." This implies that the corrective pattern unfolding in the market is potentially following a Zigzag structure within the broader Elliott Wave count of black wave 2. Recognizing this corrective structure is crucial for traders to anticipate potential price movements.
The identified "Position" is labeled as "Red wave 3," providing insights into the current position of the market within the broader Elliott Wave sequence. This information is essential for traders to comprehend the context of the correction within the overall trend.
In terms of "Direction Next Higher Degrees," the analysis points to the anticipated "black wave 3." This indicates that, following the completion of the current corrective wave (likely Zigzag) labeled as black wave 2, the market is expected to resume its upward direction as part of the broader trend.
The "Details" section mentions that "blue wave 5 of 1" has been completed at 1.11403, signaling the conclusion of the preceding impulsive wave. The market is currently engaged in a corrective phase labeled as "black wave 2," providing traders with a reference point for their analysis.
The "Wave Cancel invalid level" is identified as "1.04516," indicating that if the market reaches this level, the current wave count would be invalidated. Traders may need to reassess their analysis in such a scenario.
In summary, the EURUSD Elliott Wave Analysis for the Day Chart on 10 January 24, suggests that the market is currently in a corrective phase, potentially following a Zigzag structure within black wave 2. Traders are advised to monitor the completion of this correction and be prepared for a potential continuation of the upward trend in black wave 3. The invalidation level at 1.04516 provides a critical point for assessing the accuracy of the Elliott Wave count.
Technical Analyst: Malik Awais
Source: Tradinglounge.com get trial here!