SPDR Select Sector Fund ETF – TradingLounge Daily Chart
SPDR Select Sector Fund ETF Daily Chart Insights
XLF Elliott Wave Technical Analysis
Function: Major Trend
Mode: Motive
Structure: Impulse Wave
Position: Wave [v] navy
Direction: Uptrend
Daily Chart Insights
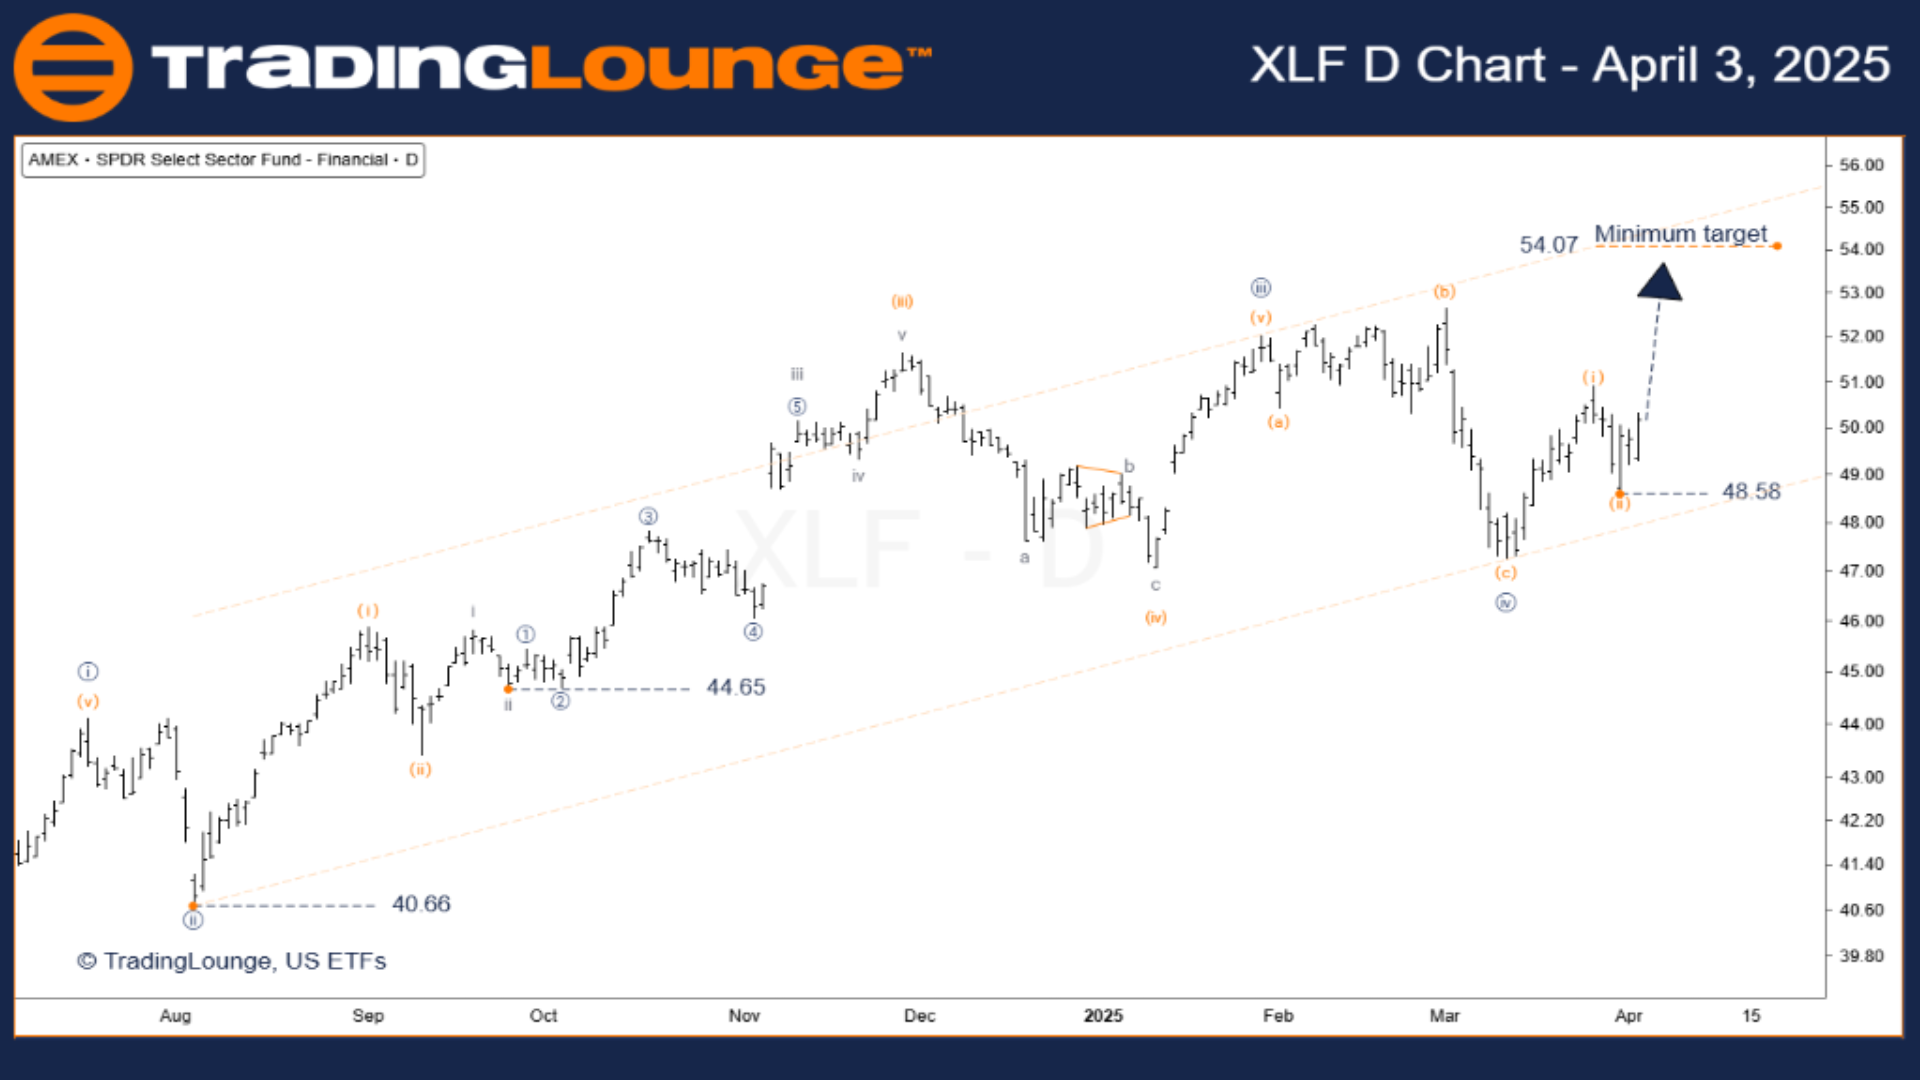
XLF is currently progressing in the fifth wave of an Elliott Wave impulse, with a minimum target at $54.07.
We're within wave (iii) of [v], recognized as the strongest and most dynamic segment of a motive wave.
This bullish momentum is likely to push XLF above the previous wave [iii] peak, reinforcing the ongoing uptrend.
Invalidation Level: $48.58 – A drop below this threshold would invalidate the current wave count.
SPDR Select Sector Fund ETF – TradingLounge 4-Hour Chart
XLF (4H) Elliott Wave Technical Analysis
Function: Major Trend
Mode: Motive
Structure: Impulse
Position: Wave (iii) orange
Direction: Uptrend
SPDR 4-Hour Chart Insights
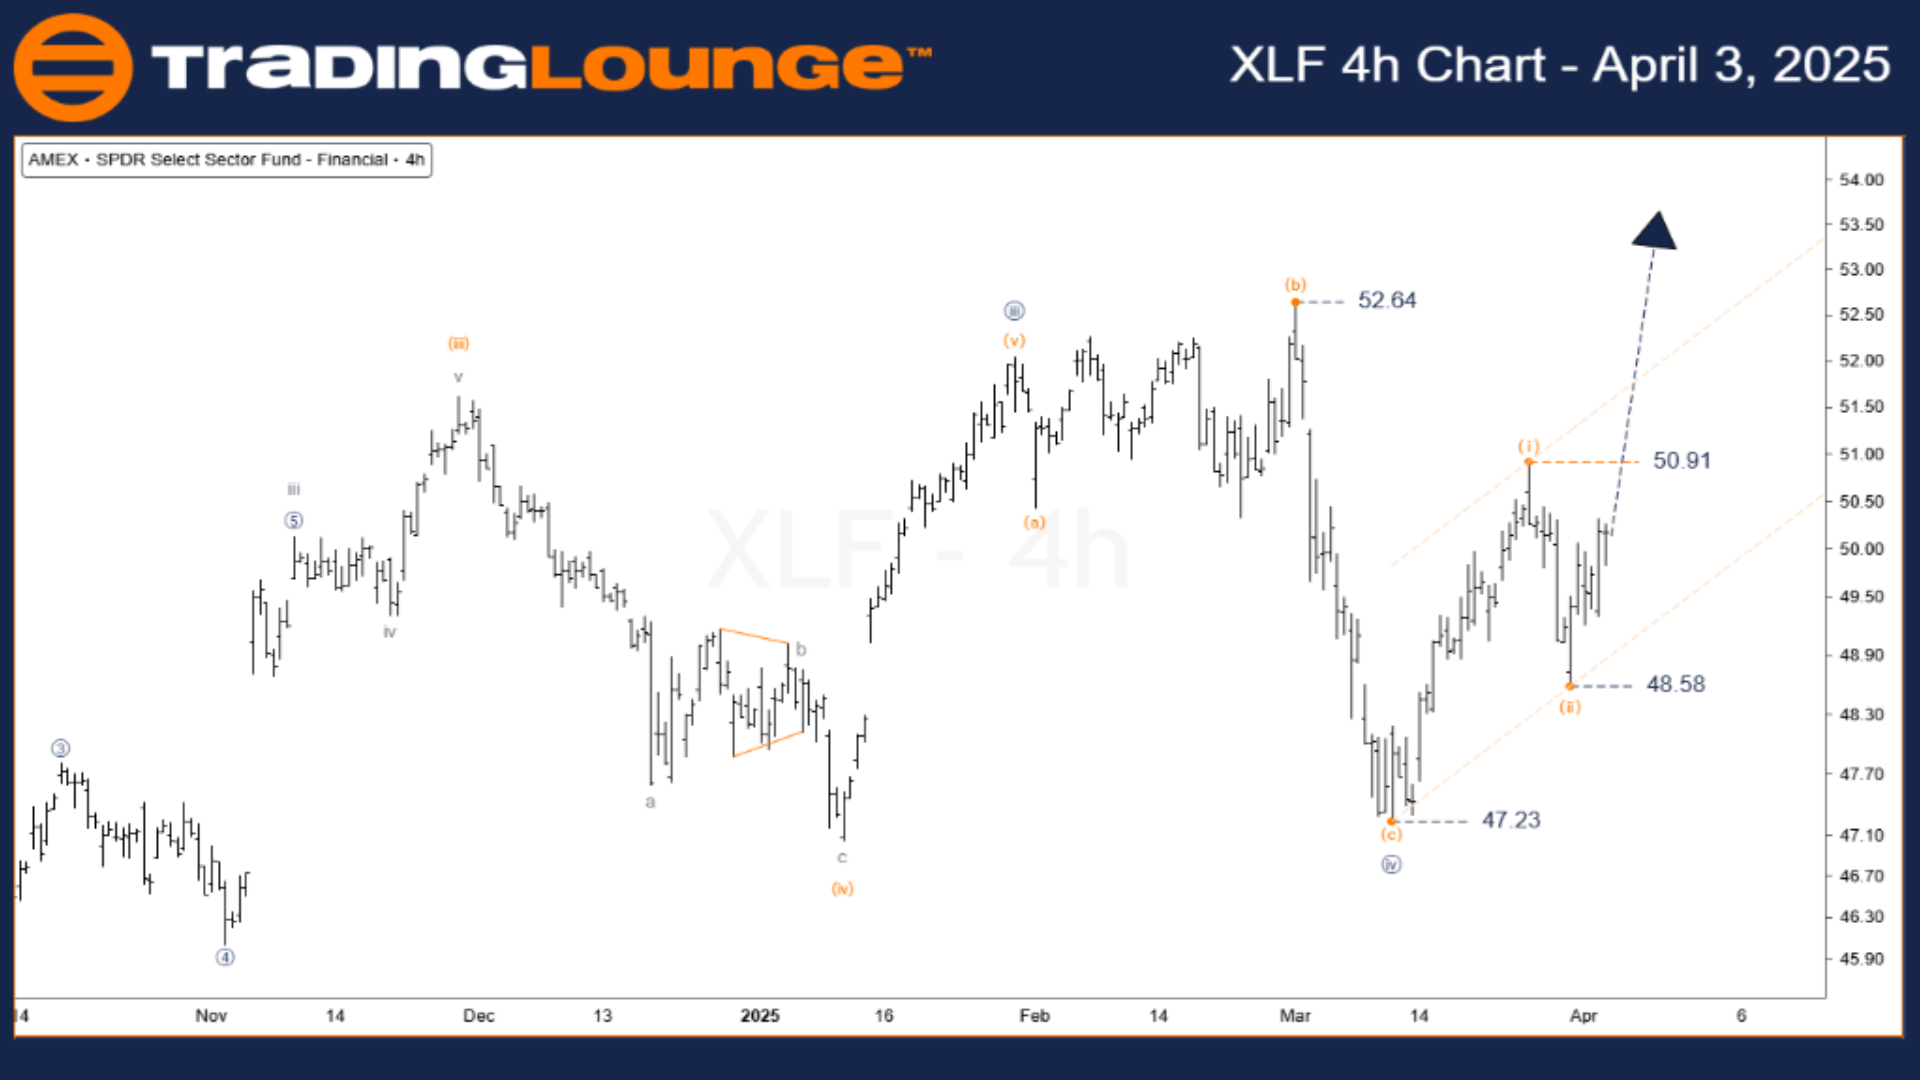
Wave (ii) concluded at $48.58, which lessens the chance of a complex corrective structure—a favorable sign for bulls.
Wave (iii) is now underway, suggesting a high-potential Elliott Wave buying setup.
Buyers may consider entering during this early phase of wave (iii) to capitalize on upward momentum.
- Key Confirmation Level: $50.91 – conservative traders can use this as a trigger for entries.
- Critical Support: $49.50 – essential to watch for trend continuation.
- Invalidation Level: $48.58 – this must hold to keep the bullish forecast valid.
Technical Analyst: Siinom
Source: Visit Tradinglounge.com and learn from the Experts. Join TradingLounge Here
See Previous: VanEck Gold Miners ETF – GDX Elliott Wave Technical Analysis
VALUE Offer - Buy 1 Month & Get 3 Months!Click here
Access 7 Analysts Over 200 Markets Covered. Chat Room With Support
Conclusion
The current Elliott Wave formation on XLF signals a strong fifth wave rally, with a price target of $54.07.
This setup supports long positions for ETF traders, especially those following wave-based trading systems.