09Jan

Exxon Mobil Inc.(XOM:NYSE) Elliott Wave Technical Analysis 9 January 24

Exxon Mobil Inc., Elliott Wave Technical Analysis

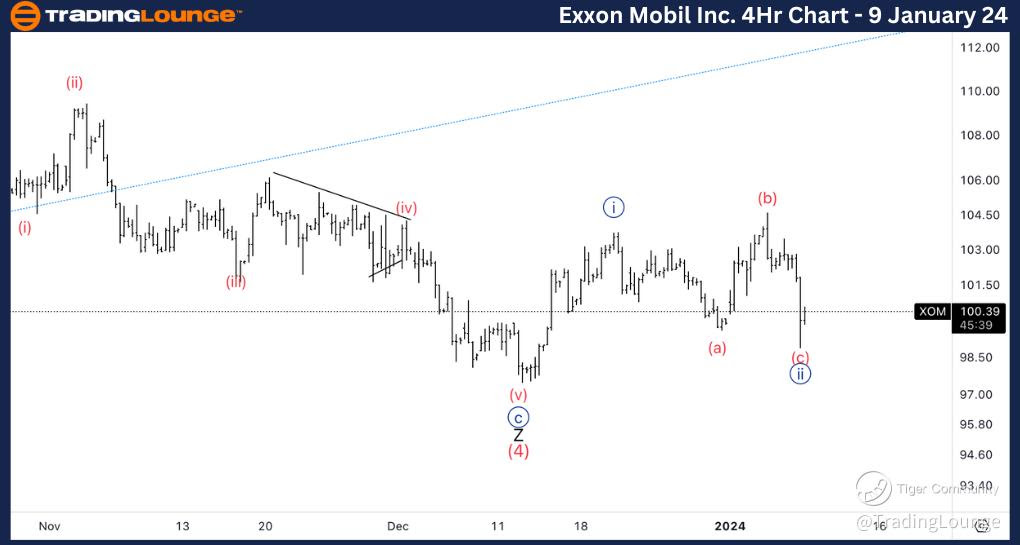
Exxon Mobil Inc., (XOM:NYSE): 4h Chart 9 January 24

XOM Stock Market Analysis: As we are trading around a Major level-100$- we need to be mindful, there is a possibility we have five waves off the bottom in a leading diagonal and we could now be correcting in wave {ii}.  

XOM Elliott Wave Count: Wave {ii} of 1.  

XOM Technical Indicators: Below all averages.

XOM Trading Strategy: Looking for longs after a Trading Level Pattern on 100$ and a break of (b).

TradingLounge Analyst: Alessio Barretta

Source: Tradinglounge.com get trial here!
Exxon-Mobil-Inc-4Hr-...


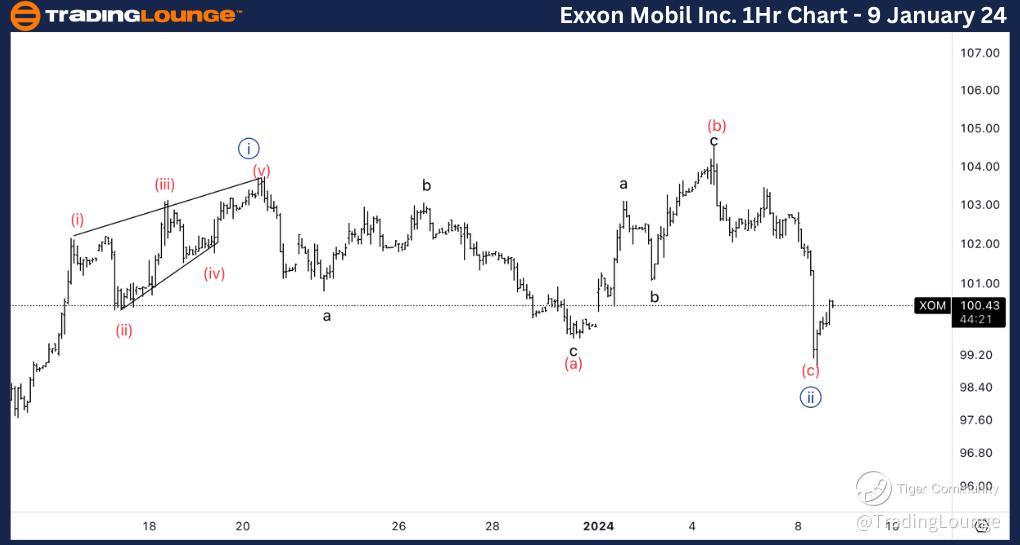
Exxon Mobil Inc., XOM: 1-hour Chart 9 January 24

Exxon Mobil Inc., Elliott Wave Technical Analysis 

XOM Stock Market Analysis: Looking for a potential bottom in place in wave (c) knowing we could still continue lower as we seem to be missing a fifth wave. Looking for a break of (b) before considering longs.  

XOM Elliott Wave count:  Wave (i) of {i}.  

XOM Technical Indicators: Below all averages.

XOM Trading Strategy: Looking for longs after a Trading Level Pattern on 100$ and a break of (b).
Exxon-Mobil-Inc-1Hr-...

Related

U.S. Dollar / Swiss Franc Forex Currency Pair and  USDCHF Elliott Wave Technical Analysis Focusing on Daily and 4-hour Charts

U.S. Dollar / Swiss Franc Forex Currency Pair and USDCHF Elliott Wave Technical Analysis Focusing on Daily and 4-hour Charts

This article provides a comprehensive USDCHF Elliott Wave analysis, focusing on daily and 4-hour cha...

Read More >
What is Bitcoin Hash Rate ?

What is Bitcoin Hash Rate ?

The Bitcoin hash rate measures the total computational power used by miners to process transactions ...

Read More >
Vanguard Australian Shares Index V300AEQ ETF UNITS – VAS Stock Analysis & Elliott Wave Technical Forecast

Vanguard Australian Shares Index V300AEQ ETF UNITS – VAS Stock Analysis & Elliott Wave Technical Forecast

This article provides an in-depth Elliott Wave analysis of ASX: V300AEQ ETF Units – VAS, focusing o...

Read More >
Looking to buy Bovespa stocks, invest in index funds: Bovespa Index Elliott Wave Technical Analysis

Looking to buy Bovespa stocks, invest in index funds: Bovespa Index Elliott Wave Technical Analysis

This article offers a thorough Elliott Wave analysis of the Bovespa Index, providing valuable insigh...

Read More >
Mastering Apple Stock: Your Guide to Trading AAPL with Elliott Wave Technical Analysis

Mastering Apple Stock: Your Guide to Trading AAPL with Elliott Wave Technical Analysis

This detailed guide provides an in-depth Elliott Wave analysis of Apple Inc (AAPL) for 2024, offerin...

Read More >

$1 for 2 Weeks

then $29 a month!

What a Special Offer!

Trade Recommendations

Unleash the power of deversified trading with our comprehensive portfolio, covering 250+ markets:

  • Stock Trades
  • Crypto Trades
  • Forex Trades
  • Commodity Trades
Elliott Wave Analysis

Gain a competitive edge with expert insights and AI-powered Elliott Wave charting into:

  • Global Indices
  • US Stocks & ASX Stocks
  • Forex & Crypto
  • Commodities
Top-Notch Trading Tools

Equip yourself with the tools of success:

  • Real-time Chat rooms
  • Elliott Wave Algorithm
  • Portfolio tools
  • TradingLevels
  • Screener
  • Trading Game
7 Elliott Wave Analysts

Stay ahead of the market with daily charts and insightful videos
Your secret to strategic trading!

JOIN HERE


Welcome to TradingLounge (ASIC A.R.No. 321187), specialists in trades, trading education and technical analysis, covering stocks, indices, commodities, forex and cryptocurrencies.

When you join TradingLounge you have access to everything we offer, including trade tools, educational content and a social platform to chat with like-minded investors.

Read more

@Copyright 2024 by tradinglounge.com

Contact Us

Australian no: 02 4787 6020

International no: +61 (2) 47876020

Pay with:

Find us on