14Nov

QUALCOMM Inc. (QCOM) Stocks Elliott Wave Technical Analysis: QUALCOMM Stock Trends, Forecasts & Trading Strategies

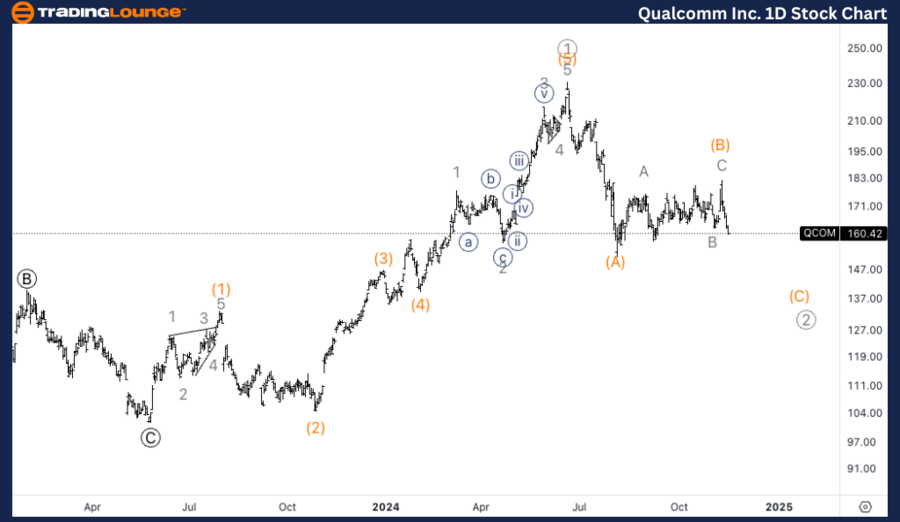
QUALCOMM Inc. (QCOM) Elliott Wave Analysis – Trading Lounge Daily Chart

QCOM Elliott Wave Technical Analysis

Function: Counter Trend

Mode: Corrective

Structure: ZigZag

Position: Wave (C) of 2

Direction: Downside in wave (C)

Details:
QUALCOMM Inc. (QCOM) is currently in a corrective phase within Primary degree wave 2, specifically progressing through wave (C) of a ZigZag structure. There is a possibility that the stock has formed a larger top at $230, suggesting that QCOM may be undergoing a higher-degree correction. Further downside is anticipated as this correction unfolds.

QCOM Daily Chart Overview:

QCOM is in wave (C) of Primary degree wave 2, a corrective ZigZag structure. A deeper correction is expected as the price moves downward, with the previous top near $230 indicating the start of this phase.

QUALCOMM-Inc-1d-stoc...


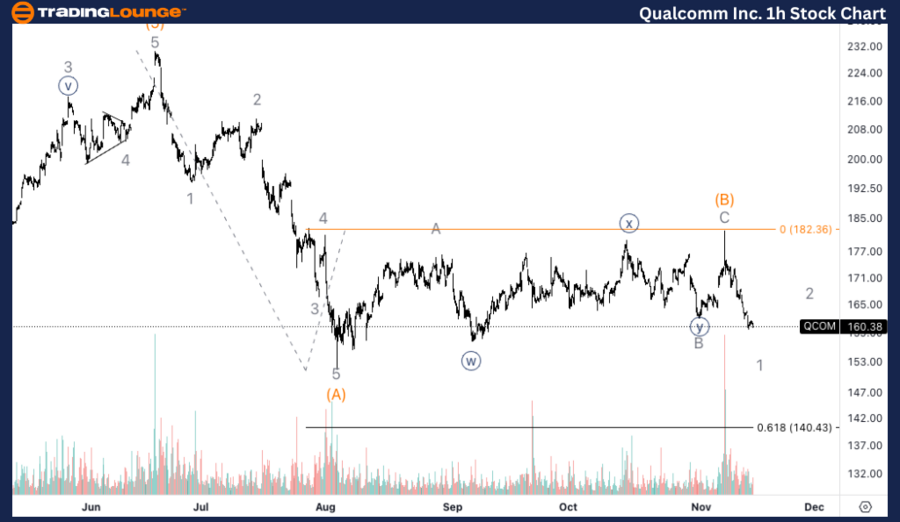
QUALCOMM Inc. (QCOM)  Elliott Wave Analysis – Trading Lounge 1-Hour Chart

QCOM Elliott Wave Technical Analysis

Function: Counter Trend

Mode: Corrective

Structure: ZigZag

Position: Wave 1 of (C)

Direction: Bottom in wave 1

Details:
On the 1-hour chart, QCOM appears to be concluding wave 1 of (C) within the corrective structure. After wave 1 is complete, a pullback in wave 2 is likely, offering a potential shorting opportunity. The 0.618 Fibonacci retracement of wave (C) vs. wave (A) stands around $140, which could act as a target level for the larger corrective move.

QCOM 1-Hour Chart Overview:

1-Hour Chart: A bottom in wave 1 of (C) is anticipated, followed by a pullback into wave 2, which could present shorting opportunities. The Fibonacci 0.618 level around $140 acts as a key downside target.

By closely monitoring these levels and corrective phases, traders can align strategies with QCOM's Elliott Wave structure.

Technical Analyst: Alessio Barretta

Source: visit Tradinglounge.com and learn From the Experts Join TradingLounge Here 

See Previous: CRM Elliott Wave Technical Analysis  

VALUE Offer - Buy 1 Month & Get 3 Months!Click here

Access 7 Analysts Over 200 Markets Covered. Chat Room With Support

QUALCOMM-Inc-1h-stoc...

Related

Copper Commodity Elliott Wave Technical Analysis: Ongoing Corrections, Wave Structures, and Key Resistance Zones

Copper Commodity Elliott Wave Technical Analysis: Ongoing Corrections, Wave Structures, and Key Resistance Zones

This article provides a detailed analysis of Copper prices using Elliott Wave theory. It covers the ...

Read More >
Ethereum ETH (ETH-USD) Price Chart Analysis daily | ETHUSD Elliott Wave Technical Analysis daily

Ethereum ETH (ETH-USD) Price Chart Analysis daily | ETHUSD Elliott Wave Technical Analysis daily

Elliott Wave Analysis TradingLounge Daily Chart, 11 October 23 Ethereum/U.S. dollar(ETHUSD) ETHUSD...

Read More >
GBPUSD Accurate Trend and Market Forecasts: British Pound/U.S. Dollar Forex Elliott Wave Technical Analysis

GBPUSD Accurate Trend and Market Forecasts: British Pound/U.S. Dollar Forex Elliott Wave Technical Analysis

The GBPUSD Elliott Wave analysis provides comprehensive insights into market movements and projectio...

Read More >
Nikkei 225 Index Elliott Wave Technical Analysis: Timely Updates, Expert Forecasts, and Recommended N225 investment tips

Nikkei 225 Index Elliott Wave Technical Analysis: Timely Updates, Expert Forecasts, and Recommended N225 investment tips

Dive into a comprehensive Elliott Wave analysis of the Nikkei 225 (N225) with insights on bullish tr...

Read More >
Bitcoin Crypto Price News Today BTCUSD Elliott Wave Technical Analysis: Focusing on BTCUSD Price Movements

Bitcoin Crypto Price News Today BTCUSD Elliott Wave Technical Analysis: Focusing on BTCUSD Price Movements

This article provides an in-depth Bitcoin Elliott Wave analysis, focusing on BTCUSD price movements....

Read More >
Analog Devices Inc.(ADI:NASDAQ) Elliott Wave Technical Analysis 29 November 23

Analog Devices Inc.(ADI:NASDAQ) Elliott Wave Technical Analysis 29 November 23

Analog Devices Inc.(ADI: NASDAQ) Elliott Wave Technical Analysis dated 29 November 23, Analog Device...

Read More >

$1 for 2 Weeks

then $29 a month!

What a Special Offer!

Trade Recommendations

Unleash the power of deversified trading with our comprehensive portfolio, covering 250+ markets:

  • Stock Trades
  • Crypto Trades
  • Forex Trades
  • Commodity Trades
Elliott Wave Analysis

Gain a competitive edge with expert insights and AI-powered Elliott Wave charting into:

  • Global Indices
  • US Stocks & ASX Stocks
  • Forex & Crypto
  • Commodities
Top-Notch Trading Tools

Equip yourself with the tools of success:

  • Real-time Chat rooms
  • Elliott Wave Algorithm
  • Portfolio tools
  • TradingLevels
  • Screener
  • Trading Game
7 Elliott Wave Analysts

Stay ahead of the market with daily charts and insightful videos
Your secret to strategic trading!

JOIN HERE


Welcome to TradingLounge (ASIC A.R.No. 321187), specialists in trades, trading education and technical analysis, covering stocks, indices, commodities, forex and cryptocurrencies.

When you join TradingLounge you have access to everything we offer, including trade tools, educational content and a social platform to chat with like-minded investors.

Read more

@Copyright 2024 by tradinglounge.com

Contact Us

Australian no: 02 4787 6020

International no: +61 (2) 47876020

Pay with:

Find us on