10Jul

ServiceNow Inc. (NOW) U.S. Stocks Elliott Technical Wave Analysis: Targeting Wave (v) Upside on Daily Chart and Wave {V} on Weekly Trend Analysis

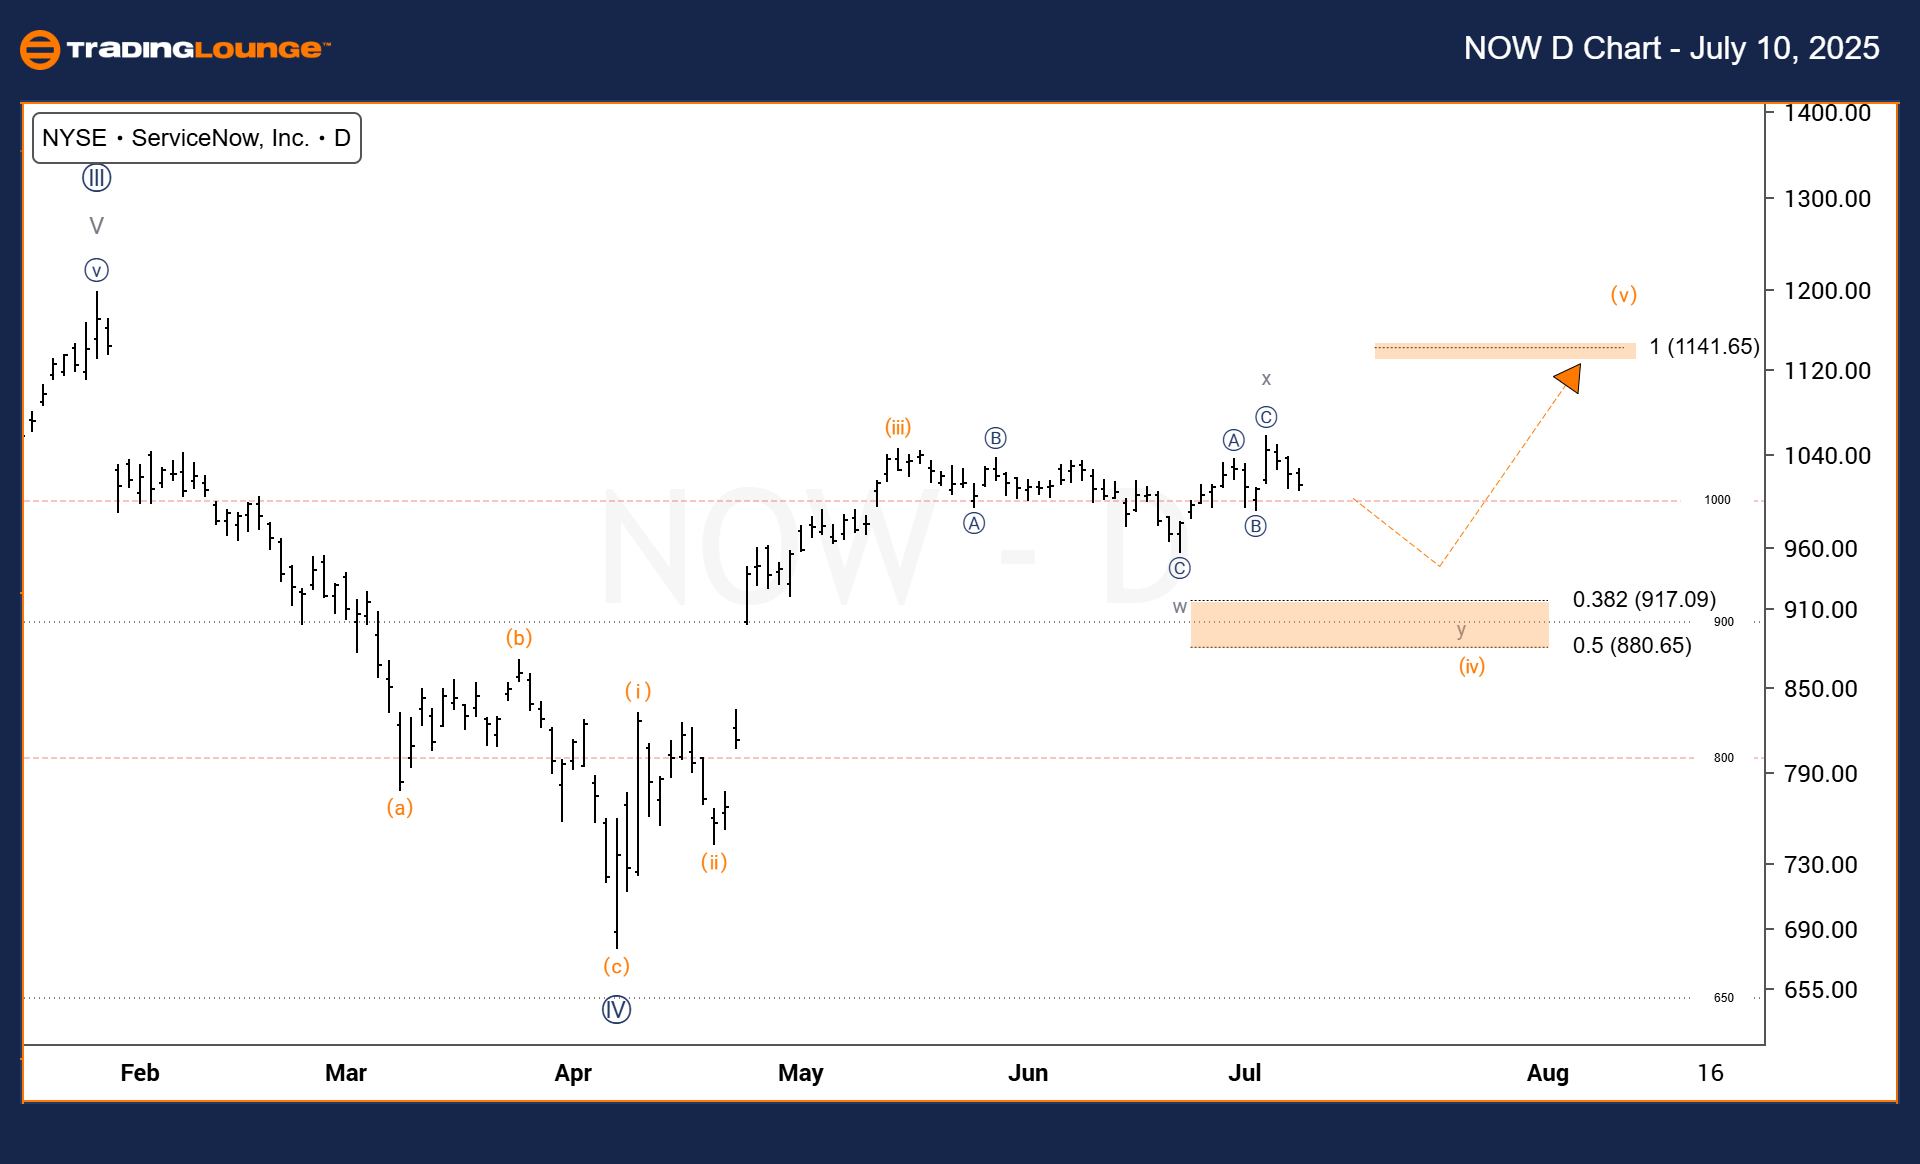
ServiceNow Inc. (NOW) Elliott Wave Forecast - Trading Lounge (Daily Chart)

ServiceNow Inc. (NOW) US Stock Daily Chart Forecast

ServiceNow Inc. (NOW) Elliott Wave Technical Analysis

  • Function: Trend
  • Mode: Motive
  • Structure: Impulsive
  • Position: Wave (v)
  • Direction: Uptrend
  • Details: Following the end of Wave (iv), ServiceNow (NOW) is expected to advance into Wave (v), potentially reaching a level equal to Wave (i).

Daily Chart Overview

ServiceNow Inc. (NYSE: NOW) is displaying continued strength on the daily chart as it progresses into Wave (v) of the Elliott Wave sequence. Wave (iv) appears to be in a corrective stage, with probable completion in the 38.2%–50% Fibonacci retracement range. Once this retracement finalizes, Wave (v) is projected to follow, potentially matching the scale of Wave (i). This setup creates a favorable scenario for bullish traders, highlighting short-term upside potential. The current impulsive wave formation reflects a continuation of the upward trend.

NOW-Stock-D-Chart-10...


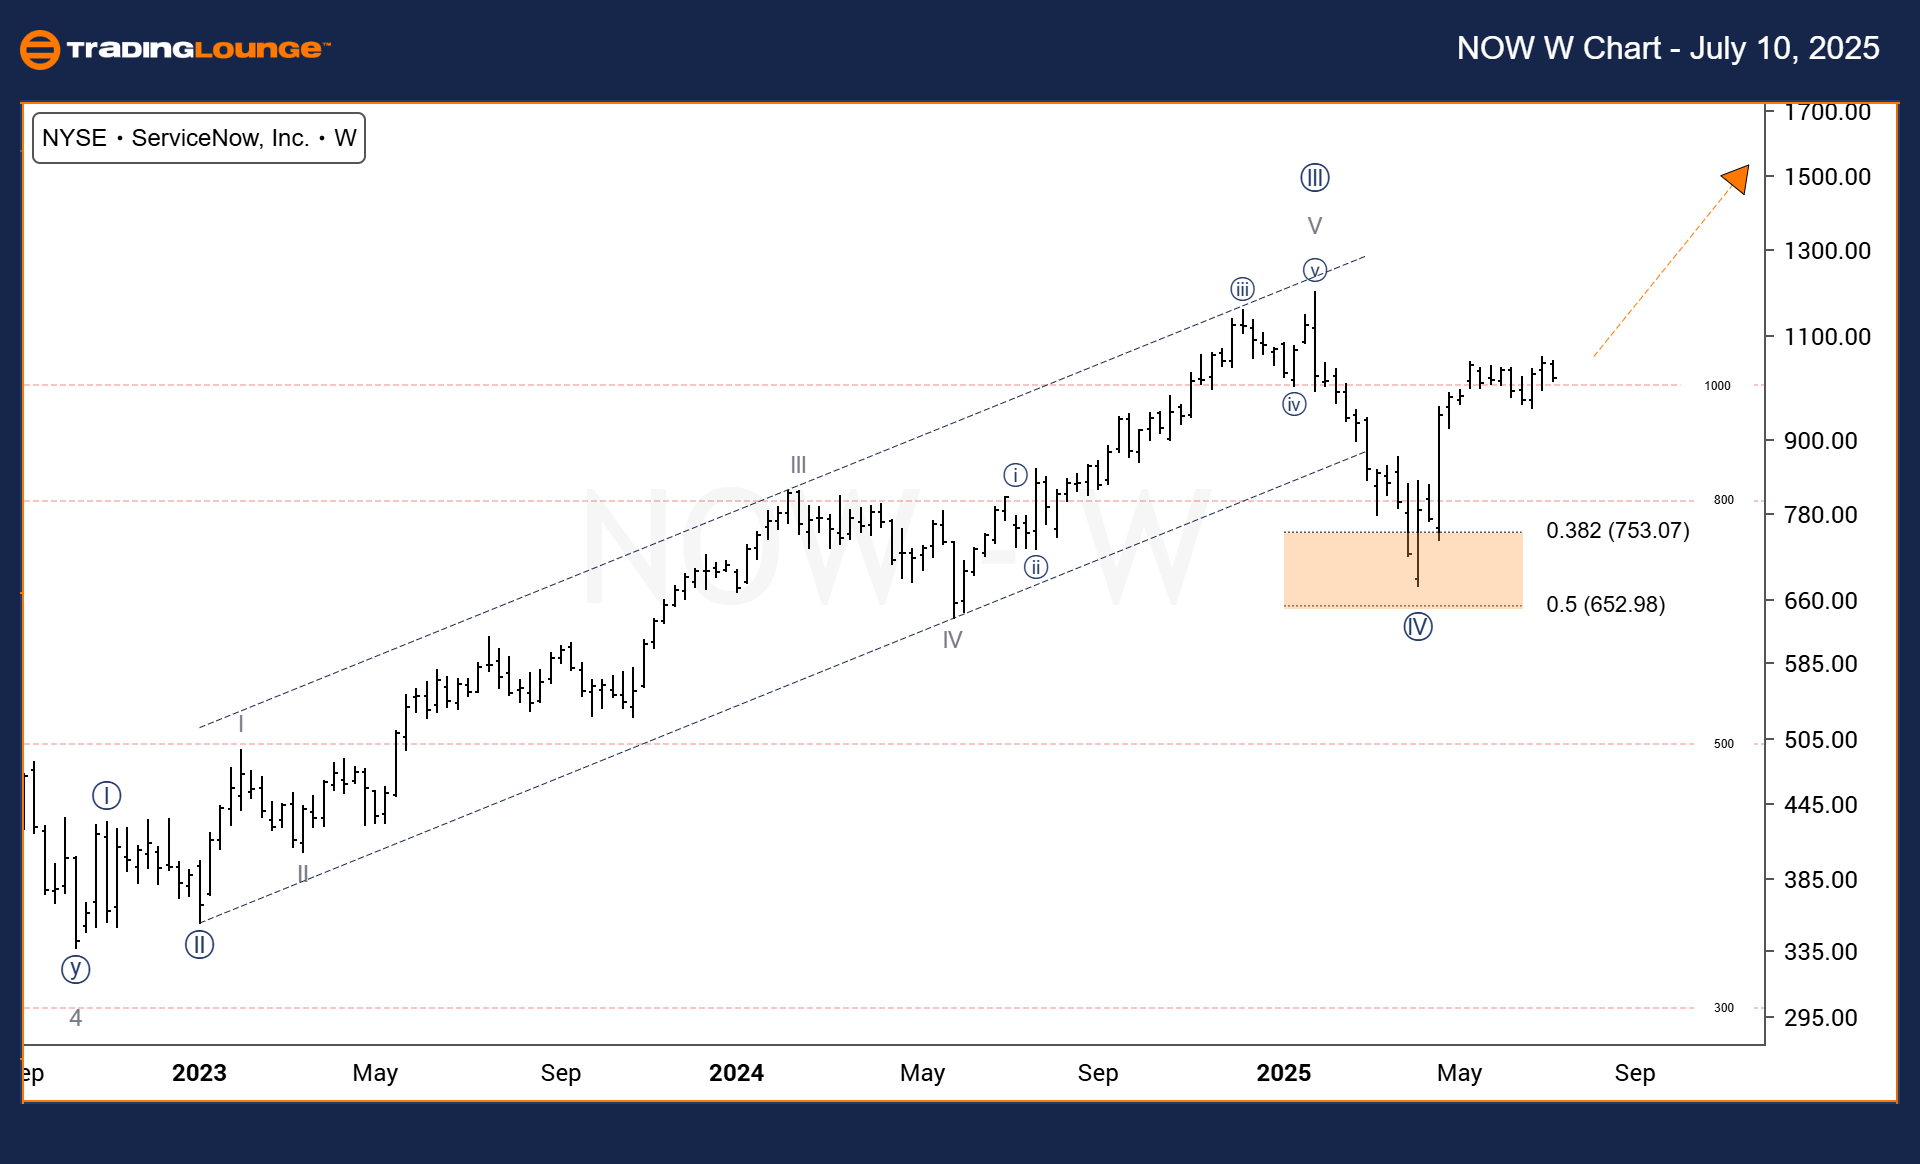
ServiceNow Inc. (NOW) – Elliott Wave Forecast (Weekly Chart)

ServiceNow Inc. (NOW) Technical Analysis – Trading Lounge

  • Function: Trend
  • Mode: Motive
  • Structure: Impulsive
  • Position: Wave {V}
  • Direction: Uptrend
  • Details: The bullish path toward Wave {V} remains intact after a rebound from the 50% Fibonacci retracement zone in April.

Weekly Chart Insight

On the weekly chart, ServiceNow (NOW) preserves its bullish Elliott Wave structure, aiming for the completion of Wave {V}. After Wave {IV} ended around April, near the 50% Fibonacci retracement, the stock gained momentum. This ongoing impulsive movement supports a positive long-term outlook. Traders should monitor key resistance levels and watch for consolidation signals as Wave {V} evolves.

Technical Analyst: Dhiren Pahuja

Visit: TradingLounge.com for detailed analysis and market updates.

Previous: Carvana Co. (CVNA) Elliott Wave Technical Analysis

VALUE Offer - $1 for 2 Weeks then $29 a month!Click here

Access 7 Analysts Over 200 Markets Covered. Chat Room With Support

NOW-Stock-W-Chart-10...

Related

U.S.Dollar/Swiss Franc(USDCHF) 4Hour Chart Elliott Wave Technical Analysis 14 December 23

U.S.Dollar/Swiss Franc(USDCHF) 4Hour Chart Elliott Wave Technical Analysis 14 December 23

U.S.Dollar/Swiss Franc(USDCHF) 4Hour Chart Elliott Wave Technical Analysis 14 December 23 expectatio...

Read More >
Euro Stoxx 50 Index Elliott Wave Technical Analysis – Forecast, Trends & Anticipate Price Movements and Identify Market Trends

Euro Stoxx 50 Index Elliott Wave Technical Analysis – Forecast, Trends & Anticipate Price Movements and Identify Market Trends

Euro Stoxx 50 Elliott Wave analysis highlights a bullish trend with impulsive wave patterns. Stock m...

Read More >
Trend Analysis: SP500, NASDAQ,  AAPL,  AMZN,  NVDA,  META,  NFLX,  GOOGL,  MSFT,  TSLA &  Bitcoin

Trend Analysis: SP500, NASDAQ, AAPL, AMZN, NVDA, META, NFLX, GOOGL, MSFT, TSLA & Bitcoin

Stocks and Indices are in a Elliott Wave four corrective pattern and in the final stages over the we...

Read More >
Euro/ U.S. Dollar (EURUSD) Elliott Wave Forecast Shows Bullish Trend Nearing Completion with Key Trading Insights

Euro/ U.S. Dollar (EURUSD) Elliott Wave Forecast Shows Bullish Trend Nearing Completion with Key Trading Insights

EURUSD Elliott Wave analysis highlights a bullish trend approaching completion on daily and 4-hour c...

Read More >
U.S.Dollar/Canadian Dollar(USD/CAD) Elliott Wave Technical Analysis 24 October 23

U.S.Dollar/Canadian Dollar(USD/CAD) Elliott Wave Technical Analysis 24 October 23

In summary, the USD/CAD Elliott Wave Analysis for 24 October 23, is significant for traders seeking ...

Read More >
Effective Trading Strategies to help you Navigate the Market: Natural Gas Commodity Elliott Wave Technical Analysis

Effective Trading Strategies to help you Navigate the Market: Natural Gas Commodity Elliott Wave Technical Analysis

Discover an in-depth natural gas analysis focusing on price movements, Elliott Wave theory, and mark...

Read More >

$1 for 2 Weeks

then $29 a month!

What a Special Offer!

Trade Recommendations

Unleash the power of deversified trading with our comprehensive portfolio, covering 250+ markets:

  • Stock Trades
  • Crypto Trades
  • Forex Trades
  • Commodity Trades
Elliott Wave Analysis

Gain a competitive edge with expert insights and AI-powered Elliott Wave charting into:

  • Global Indices
  • US Stocks & ASX Stocks
  • Forex & Crypto
  • Commodities
Top-Notch Trading Tools

Equip yourself with the tools of success:

  • Real-time Chat rooms
  • Elliott Wave Algorithm
  • Portfolio tools
  • TradingLevels
  • Screener
  • Trading Game
7 Elliott Wave Analysts

Stay ahead of the market with daily charts and insightful videos
Your secret to strategic trading!

JOIN HERE


Welcome to TradingLounge (ASIC A.R.No. 321187), specialists in trades, trading education and technical analysis, covering stocks, indices, commodities, forex and cryptocurrencies.

When you join TradingLounge you have access to everything we offer, including trade tools, educational content and a social platform to chat with like-minded investors.

Read more

@Copyright 2024 by tradinglounge.com

Contact Us

Australian no: 02 4787 6020

International no: +61 (2) 47876020

Pay with:

Find us on