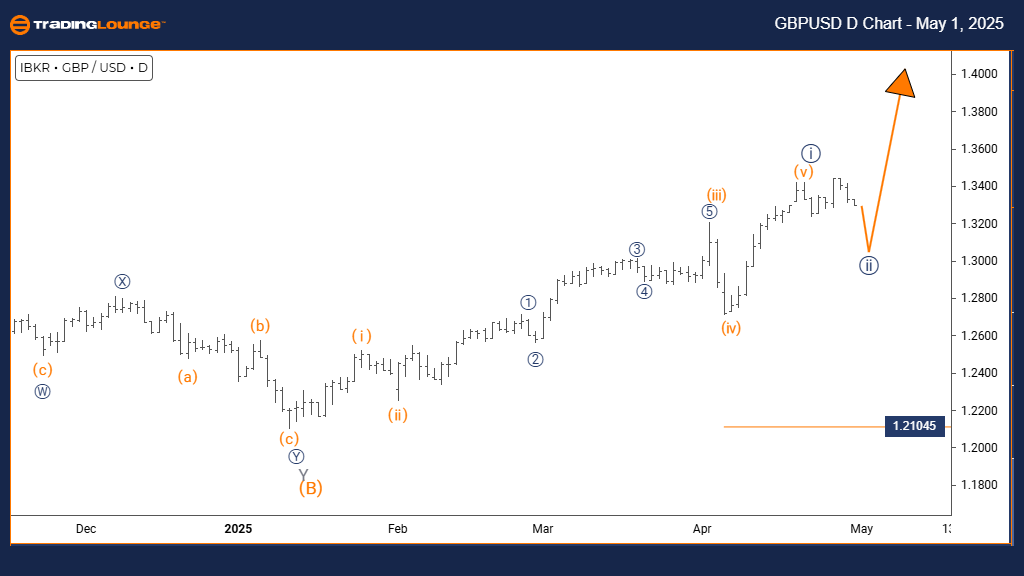
British Pound/ U.S. Dollar Elliott Wave Analysis - TradingLounge day Chart
British Pound/ U.S. Dollar (GBPUSD) Day Chart
GBPUSD Elliott Wave Technical Analysis
Function: Counter Trend
Mode: Corrective
Structure: Navy Blue Wave 2
Position: Gray Wave 1
Direction Next Higher Degrees: Navy Blue Wave 3
Details: Navy Blue Wave 1 appears complete, with Navy Blue Wave 2 now unfolding.
Cancel Invalid Level: 1.21045
The daily Elliott Wave analysis for GBPUSD shows a counter-trend correction within a broader bearish trend. The completion of Navy Blue Wave 1 signals the start of Navy Blue Wave 2, a corrective phase within the ongoing Gray Wave 1 downtrend. This setup points to a short-term rally before the larger bearish movement potentially resumes.
Navy Blue Wave 2 typically retraces between 38% and 61% of the previous decline, forming common corrective patterns like zigzags or flats. Following the strong wave 1 sell-off, conditions now favor a pullback marked by overlapping price action and reduced momentum. The daily chart reflects a temporary pause within the prevailing bearish sequence for GBPUSD.
Next Movement Expectations
The forecast anticipates a strong downward move in Navy Blue Wave 3 following the completion of Wave 2. This third wave is expected to be powerful and could extend well below the previous low of Wave 1. Key invalidation level remains at 1.21045 — a close above this point would negate the current bearish Elliott Wave structure.
Traders should monitor Wave 2's development for reversal signs like bearish candlestick formations, overbought conditions on indicators, and distribution volume patterns. The current corrective phase offers a strategic setup for positioning ahead of the potential Wave 3 decline. Applying Fibonacci retracement tools will assist in identifying optimal entry points as GBPUSD transitions from Wave 2 into Wave 3.
This correction is considered a typical consolidation phase within the major bearish trend, presenting an opportunity for traders to prepare for the next expected move lower. Careful observation of price behavior around key retracement zones will be essential for accurate timing.
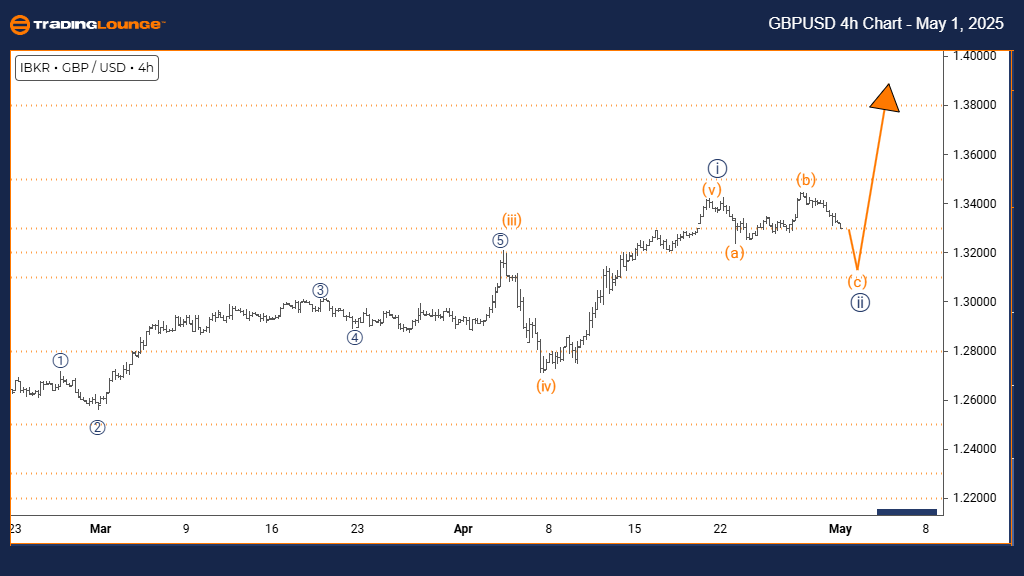
GBPUSD Elliott Wave Analysis - TradingLounge 4-Hour Chart
British Pound/ U.S. Dollar (GBPUSD) Elliott Wave Technical Analysis
Function: Counter Trend
Mode: Corrective
Structure: Navy Blue Wave 2
Position: Gray Wave 1
Direction Next Higher Degrees: Navy Blue Wave 3
Details: Navy Blue Wave 1 appears complete, with Navy Blue Wave 2 now unfolding.
Cancel Invalid Level: 1.21045
The 4-hour Elliott Wave analysis for GBPUSD highlights a counter-trend correction underway within a larger bearish formation. After completing Navy Blue Wave 1, the currency pair has entered Navy Blue Wave 2, correcting within the broader Gray Wave 1 decline. This structure suggests a short-term upward retracement before the continuation of the main bearish trend.
Navy Blue Wave 2 usually retraces 38% to 61% of the prior downward move. The setup now points to a corrective pullback characterized by overlapping price action and weakening momentum, aligning with typical corrective wave behavior. The 4-hour chart analysis suggests this is a short-term interruption in the broader downtrend for GBPUSD.
Next Movement Expectations
The next projected move is a downward Navy Blue Wave 3 once Wave 2 completes. Wave 3 is likely to be the most aggressive segment, targeting new lows beyond the bottom of Wave 1. The critical invalidation point remains at 1.21045; a break above this would invalidate the current Elliott Wave structure.
Traders should monitor Wave 2 for ending signals like bearish reversal candlestick patterns and overbought indicator readings. The current correction offers tactical entry opportunities for the expected Wave 3 decline. Technical analysis tools will assist in confirming the end of the correction and the beginning of the downward impulse.
This corrective phase is seen as a standard retracement within the broader bearish trend, giving traders a strategic chance to prepare for the next significant move down. Watching key Fibonacci retracement zones will be vital for optimizing trade entries as GBPUSD transitions from Wave 2 to Wave 3.
Technical Analyst: Malik Awais
Source: Visit Tradinglounge.com and learn from the Experts. Join TradingLounge Here
Previous: USDJPY Elliott Wave Technical Analysis
VALUE Offer - Buy 1 Month & Get 3 Months!Click here
Access 7 Analysts Over 200 Markets Covered. Chat Room With Support