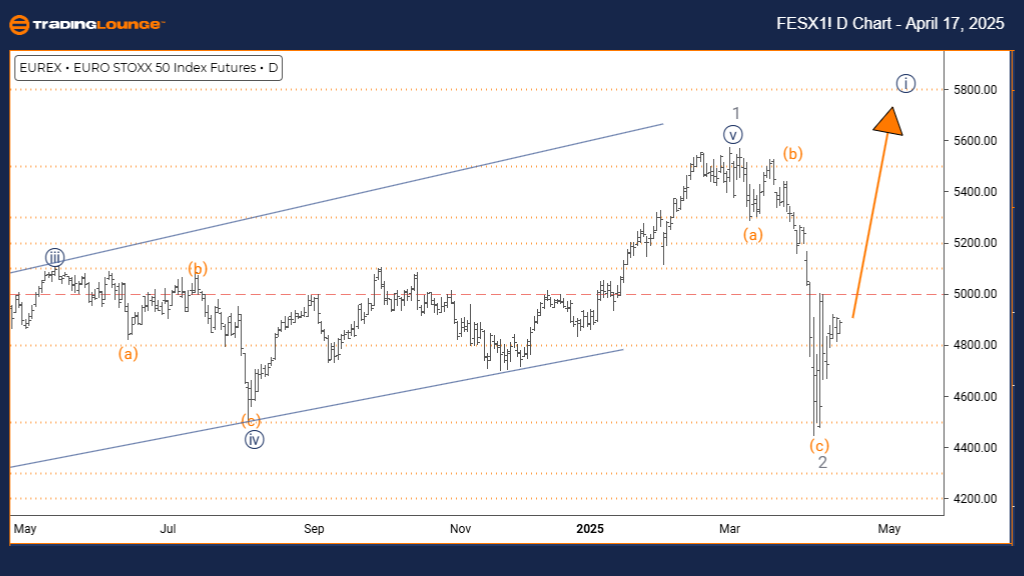
Euro Stoxx 50 Elliott Wave Analysis | TradingLounge Daily Chart
Euro Stoxx 50 Daily Chart Analysis
Euro Stoxx 50 Elliott Wave Forecast – Bullish Impulse Structure
FUNCTION: Bullish Trend
MODE: Impulsive
STRUCTURE: Navy Blue Wave 1
POSITION: Gray Wave 3
DIRECTION NEXT HIGHER DEGREES: Navy Blue Wave 1 (In Progress)
DETAILS: Gray Wave 2 appears complete; Navy Blue Wave 1 of 3 is now developing.
The Euro Stoxx 50 Elliott Wave daily chart highlights a developing bullish trend with a classic impulsive structure. Following the completion of gray wave 2, the index has now commenced navy blue wave 1, initiating the early stages of gray wave 3. This marks the beginning of a new impulsive phase with the potential for continued upward price movement in the near term.
Navy blue wave 1 signifies the initiation of this uptrend, representing a transition from correction to impulse. While early-stage impulsive waves may show modest progress, they are crucial for setting the stage for larger bullish legs. Current wave structure and momentum patterns suggest upward extension, with buyers gradually gaining control.
Gray wave 3, a higher-degree wave, suggests an acceleration in bullish activity as the wave progresses. Traders can expect increased volatility and upside potential, positioning this phase as a key opportunity in the current market cycle. The daily timeframe adds further weight to the bullish outlook, indicating the possibility of a multi-session rally building from this base.
Traders should monitor navy blue wave 1 closely, watching for typical characteristics like increasing volume and strong, sustained price movement. These signals can confirm wave structure integrity and guide bullish setups. While wave 1 tends to be less aggressive than wave 3, it remains pivotal for strategy development.
Next in sequence is navy blue wave 2, expected to form once wave 1 completes. This corrective move may present a retracement or pullback setup before a potential wave 3 surge. Analyzing momentum shifts and reversal patterns will be key to timing entries in the upcoming phases.
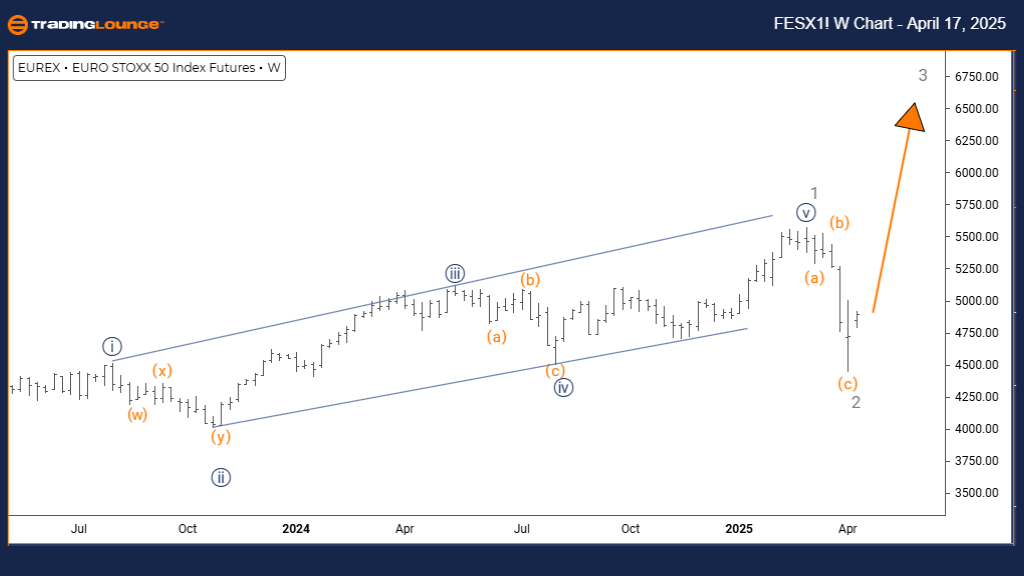
Euro Stoxx 50 Elliott Wave Analysis | TradingLounge Weekly Chart
Euro Stoxx 50 Weekly Elliott Wave Outlook – Impulsive Bullish Continuation
FUNCTION: Bullish Trend
MODE: Impulsive
STRUCTURE: Gray Wave 3
POSITION: Orange Wave 3
DIRECTION NEXT HIGHER DEGREES: Gray Wave 3 (Underway)
DETAILS: Completion of Gray Wave 2 confirmed; Gray Wave 3 now in progress.
The Euro Stoxx 50 weekly Elliott Wave chart confirms a dominant bullish trend, currently unfolding as part of an impulsive wave 3 advance. The recent completion of gray wave 2 correction has paved the way for a strong rally under gray wave 3, nested within the broader orange wave 3 formation. This wave combination typically reflects heightened bullish momentum and extended price gains.
Gray wave 3 is traditionally the strongest and most dynamic wave within an Elliott impulse cycle. It often delivers the sharpest price increases and longest trend duration, outpacing the initial wave 1 in both depth and intensity. With wave 2 now behind, bullish conditions appear primed for continuation and breakout scenarios.
The weekly timeframe provides a broad view, suggesting long-term bullish potential across multiple timeframes. With orange wave 3 also unfolding at a higher degree, the setup aligns with a sustained rally that could attract long-term investors and trend followers alike.
Key signals for gray wave 3 include rising volume, strong upward price momentum, and sustained bullish sentiment. Traders are encouraged to maintain long positions while monitoring indicators for early signs of wave fatigue. Technical confirmation through volume and breakout structures will help solidify trade setups during this phase.
Following this leg, the expected development is gray wave 4—a corrective phase offering a potential pullback. This stage may present a buying opportunity before the final wave 5 thrust. Wave 3 periods are typically optimal for momentum-based strategies due to their favorable trend conditions and risk-to-reward profile.
Technical Analyst: Malik Awais
Source: Visit Tradinglounge.com and learn from the Experts. Join TradingLounge Here
Previous: S&P BSE SENSEX NEXT 50 Elliott Wave Technical Analysis
VALUE Offer - Buy 1 Month & Get 3 Months!Click here
Access 7 Analysts Over 200 Markets Covered. Chat Room With Support