30Jun

British Pound / Japanese Yen Forex Elliott Wave Technical Analysis: Shows Impulsive Bullish Structure Suggesting More Gains

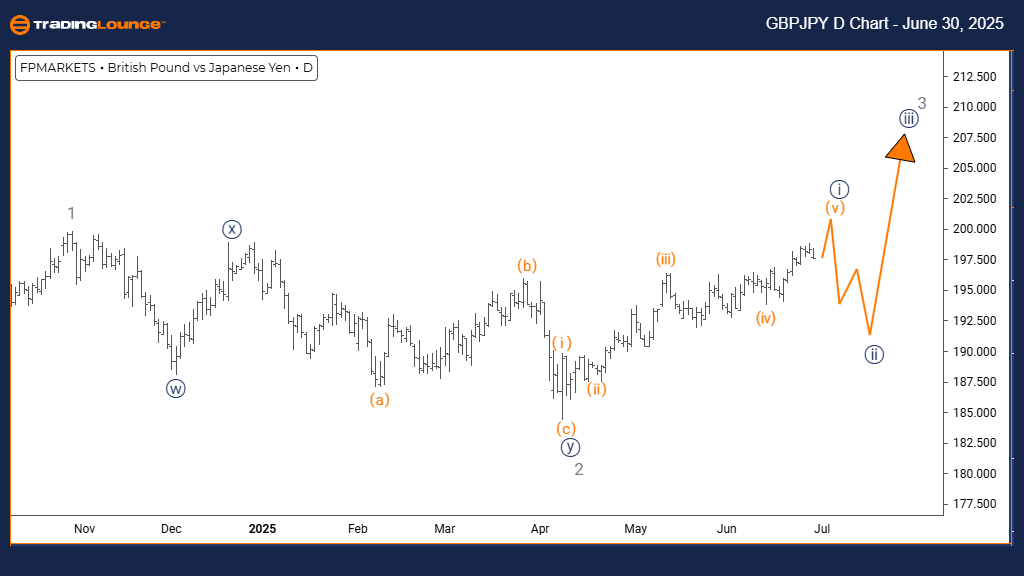
GBPJPY Elliott Wave Forecast – TradingLounge Daily Chart Update

British Pound / Japanese Yen – Daily Chart

GBPJPY Technical Overview and Elliott Wave Forecast

FUNCTION: Bullish Trend

MODE: Impulsive

STRUCTURE: Navy Blue Wave 1

POSITION: Gray Wave 3

DIRECTION (Next Lower Degree): Navy Blue Wave 2

DETAILS: Navy Blue Wave 1 is active and approaching final stages.

The GBPJPY daily chart remains in a bullish Elliott Wave structure, where price action is progressing through an impulsive move. This momentum is aligned with Navy Blue Wave 1 unfolding within the broader Gray Wave 3 trend, reflecting a medium-term upward bias in GBPJPY trading.

Wave structure analysis confirms that Navy Blue Wave 1 is nearing its termination point within Gray Wave 3. As the initial wave in an impulsive sequence, it often initiates a broader bullish trend. The upcoming phase is projected to be Navy Blue Wave 2, which generally reflects a corrective pullback following Wave 1's completion.

Overall, the Elliott Wave outlook for GBPJPY on the daily timeframe points to ongoing strength as Wave 1 progresses inside Wave 3. The impulsive price action signals institutional buying interest and suggests further gains before a potential retracement begins.

GBPJPY-forex-Day-Cha...


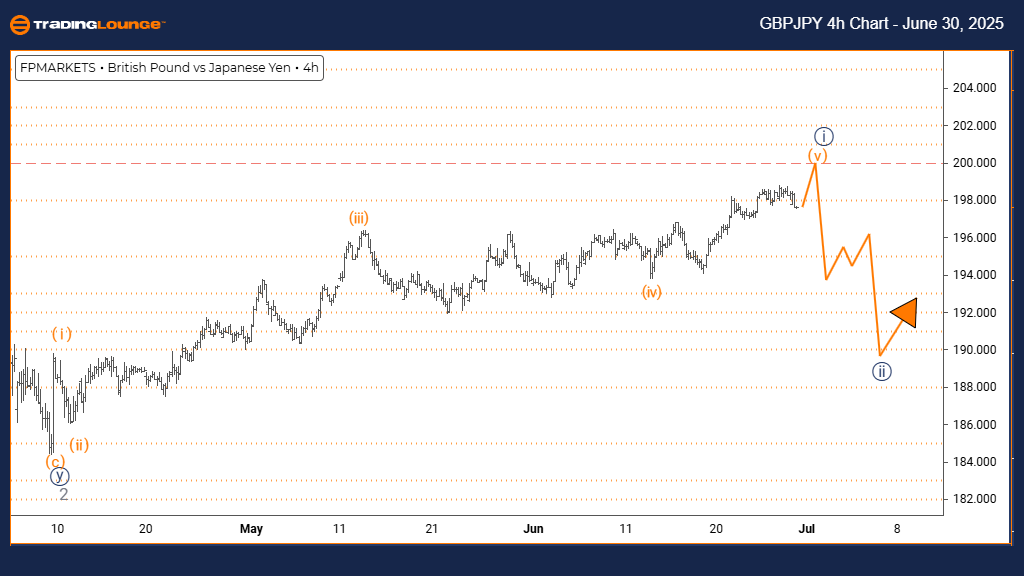
British Pound / Japanese Yen – 4-Hour Chart Technical Overview

Technical Overview – Short-Term Elliott Wave Projection

FUNCTION: Bullish Trend

MODE: Impulsive

STRUCTURE: Orange Wave 5

POSITION: Navy Blue Wave 1

DIRECTION (Next Lower Degree): Navy Blue Wave 2

DETAILS: Orange Wave 4 appears complete; Orange Wave 5 is underway.

On the GBPJPY 4-hour chart, the Elliott Wave model supports a bullish trend within an impulsive framework. Currently, the pair is advancing through Orange Wave 5, which serves as the concluding leg of Navy Blue Wave 1 in this upward sequence.

Recent wave completion of Orange Wave 4 sets the stage for the active development of Orange Wave 5. Typically, this phase involves accelerated price movement. Following this wave, the market is likely to enter Navy Blue Wave 2, a corrective phase expected after the five-wave impulse finishes.

The short-term structure signals that GBPJPY may soon reach a local peak, with Orange Wave 5 in progress. While bullish momentum continues, traders should prepare for a possible shift toward corrective behavior as Wave 2 comes into view.

Technical Analyst: Malik Awais

Source: Visit Tradinglounge.com and learn from the Experts. Join TradingLounge Here

Previous: USDJPY Elliott Wave Technical Analysis

VALUE Offer - $1 for 2 Weeks then $29 a month!Click here

Access 7 Analysts Over 200 Markets Covered. Chat Room With Support

GBPJPY-forex-4h-Char...

Related

Vanguard V300AEQ ETF UNITS – VAS Stock Analysis & Elliott Wave Technical Forecast

Vanguard V300AEQ ETF UNITS – VAS Stock Analysis & Elliott Wave Technical Forecast

Unlock the potential of your investments with our in-depth Elliott Wave analysis for ASX VAS ETF. Di...

Read More >
Understanding of the EURUSD's Forecast, Counter-Trend Movements, and Potential Market Shifts: EURUSD Elliott Wave Analysis

Understanding of the EURUSD's Forecast, Counter-Trend Movements, and Potential Market Shifts: EURUSD Elliott Wave Analysis

This EURUSD Elliott Wave analysis offers an in-depth view of the Euro Dollar's corrective wave p...

Read More >
The Procter & Gamble Co. (PG) Stock Analysis: Elliott Wave Forecast Reveals Bullish Trends and Key Resistance Levels at $165

The Procter & Gamble Co. (PG) Stock Analysis: Elliott Wave Forecast Reveals Bullish Trends and Key Resistance Levels at $165

This analysis delves into Procter & Gamble's (PG) stock performance through the lens of Elliott ...

Read More >
Advanced Micro Devices Inc. (AMD) Elliott Wave Technical Analysis Provides Traders with Valuable insights into AMD's price movements

Advanced Micro Devices Inc. (AMD) Elliott Wave Technical Analysis Provides Traders with Valuable insights into AMD's price movements

Our detailed Elliott Wave analysis for Advanced Micro Devices Inc. (AMD) provides traders with valua...

Read More >
Stock Market Analysis: Elliott Wave Predicts Potential Decline in Major Indices

Stock Market Analysis: Elliott Wave Predicts Potential Decline in Major Indices

Stock Market Summary: Counting the bearish 2 day chart and daily chart as a Wave 2) retracement, in ...

Read More >
Shanghai Composite Index Elliott Wave Technical Analysis: Master Market Trends and Wave Structures

Shanghai Composite Index Elliott Wave Technical Analysis: Master Market Trends and Wave Structures

The Elliott Wave analysis of the Shanghai Composite provides a thorough insight into market trends a...

Read More >

$1 for 2 Weeks

then $29 a month!

What a Special Offer!

Trade Recommendations

Unleash the power of deversified trading with our comprehensive portfolio, covering 250+ markets:

  • Stock Trades
  • Crypto Trades
  • Forex Trades
  • Commodity Trades
Elliott Wave Analysis

Gain a competitive edge with expert insights and AI-powered Elliott Wave charting into:

  • Global Indices
  • US Stocks & ASX Stocks
  • Forex & Crypto
  • Commodities
Top-Notch Trading Tools

Equip yourself with the tools of success:

  • Real-time Chat rooms
  • Elliott Wave Algorithm
  • Portfolio tools
  • TradingLevels
  • Screener
  • Trading Game
7 Elliott Wave Analysts

Stay ahead of the market with daily charts and insightful videos
Your secret to strategic trading!

JOIN HERE


Welcome to TradingLounge (ASIC A.R.No. 321187), specialists in trades, trading education and technical analysis, covering stocks, indices, commodities, forex and cryptocurrencies.

When you join TradingLounge you have access to everything we offer, including trade tools, educational content and a social platform to chat with like-minded investors.

Read more

@Copyright 2024 by tradinglounge.com

Contact Us

Australian no: 02 4787 6020

International no: +61 (2) 47876020

Pay with:

Find us on