Wheat Elliott Wave Analysis
Function: Counter Trend
Mode: Corrective
Structure: Zigzag for wave (B)
Position: Wave A of (B)
Direction: Wave A is still in play
Details: As it appears the decline from 720’4 will most likely continue lower, we have adjusted the previous count. Price is now very likely in wave A of (B) against the 523’6 low.
Wheat Elliott Wave Analysis
Since late May, wheat has declined over 14% from 720, indicating that the commodity has retraced approximately half of the impulse rally that occurred between March 11th and May 28th. In the medium term, the move from March 11th remains a positive correction of the long-term bearish trend that spanned from March 2022 to March 2024—a two-year trend.
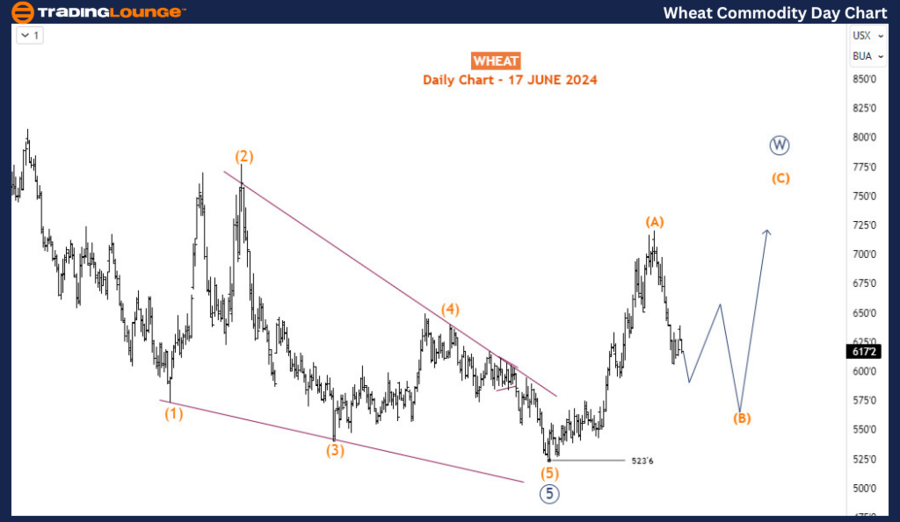
Wheat Daily Chart Analysis
On the daily chart, wheat completed a bearish impulse wave from March 2022 at 523’6 in March 2024. Following this trend, a corrective phase was anticipated in the opposite direction. The impulse reaction that concluded wave (A) at the May 2024 peak is part of this larger bullish correction. Given that wave (A) is an impulse, we can expect at least a zigzag structure or possibly a double zigzag if the bullish correction extends over several months. Following the path of least resistance, a simple zigzag structure—wave (A)-(B)-(C)—is highly probable. Currently, the price is correcting wave (A) downwards in wave (B). Provided that the ongoing decline stays above 523’6, an extension higher is expected. However, wave (B) does not appear to be finished yet, as evident from the H4 chart.
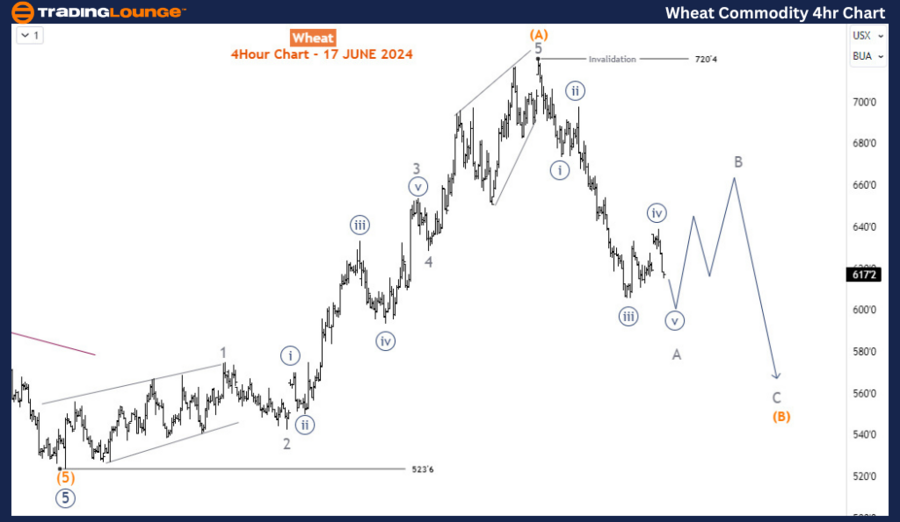
Wheat H4 Chart Analysis
On the H4 chart, the price seems to be in wave A of (B), which is evolving into an impulse structure. We anticipate a typical zigzag structure for wave (B). The invalidation level at 523’6 should not be breached. If it is, the long-term bearish trend from March 2022 will likely resume, confirming that the bullish correction from March 2024 has concluded.
Technical Analyst: Sanmi Adeagbo
Source: visit Tradinglounge.com and learn From the Experts Join TradingLounge Here
See Previous: WTI Crude Oil Elliott Wave Technical Analysis
Special Trial Offer - 0.76 Cents a Day for 3 Months! Click here
Access 7 Analysts Over 170 Markets Covered. Chat Room With Support
Summary
- Wheat has seen a significant decline since late May, retracing half of its recent impulse rally.
- The medium-term trend from March 11th remains a positive correction within the context of a long-term bearish trend that lasted two years.
- On the daily chart, the completion of the bearish impulse wave in March 2024 was followed by a bullish correction, which is currently in wave (B) of a zigzag structure.
- The H4 chart suggests that wave A of (B) is forming an impulse structure, with expectations of a typical zigzag correction.
Traders should monitor the key level of 523’6. If this level holds, the bullish correction is likely to continue with a potential extension higher. However, a breach below 523’6 would invalidate this scenario, signaling a continuation of the long-term bearish trend.