WTI Crude Oil Elliott Wave Analysis

Function: Counter-trend

Mode: Corrective

Structure: Impulse for wave 1

Position: Wave 2

Direction: Wave 2 is still in play

Details: Wave a of 2 appears to be close to completion. We could see a deeper pullback for wave b of 2 in the coming days against 72.47.

Crude Oil Elliott Wave Technical Analysis

Crude oil prices have been rising in June following a two-month sell-off that resulted in a 17% decline. The current recovery is expected to continue higher but is likely to be capped below the April 2024 highs before turning lower. It's important to note that crude oil has been undergoing a long-term bearish correction since March 2022, which appears to be ongoing.

Daily Chart Analysis

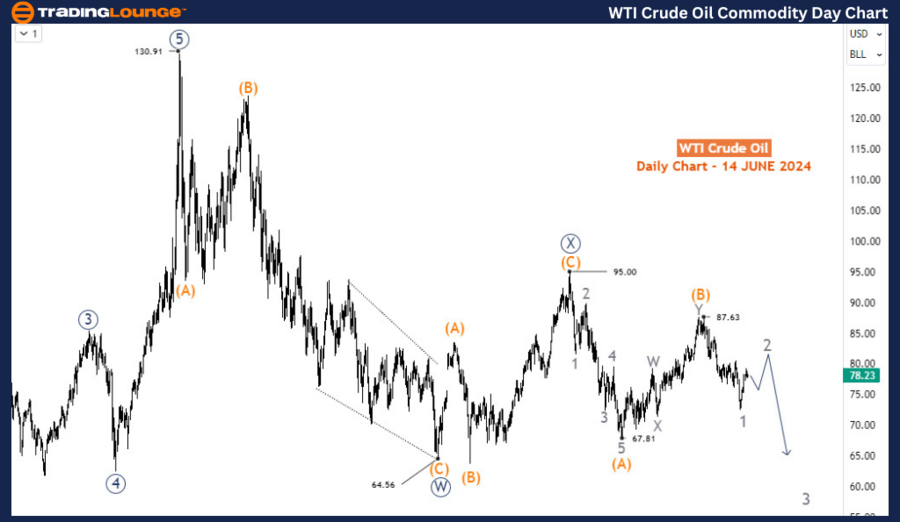
The daily chart depicts the bearish corrective cycle from March 2022 (130.9), which is evolving as a double zigzag pattern, labeled as wave W-X-Y (circled in navy blue) of the primary degree. The primary degree wave W (circled) concluded at 64.56 in March 2023 after a 360-day, 50% decline, forming a double zigzag structure. The subsequent wave X recovery began in March 2023 and ended at 95 in September 2023 with a flat structure. Consequently, wave Y started in September 2023, also developing into a zigzag pattern, with an impulse wave (A) ending at 67.81 in December 2023. The recovery wave (B) then completed with a double zigzag at 87.63 in April 2024.

Wave (C) is anticipated to be an impulse wave and is expected to decline much lower than 67.81 in the coming months. Wave 1 of (5) ended at 72.47 with an impulse, and the current recovery for wave 2 is still unfolding.
WTI-Crude-Oil-Commod...


H4 Chart Analysis

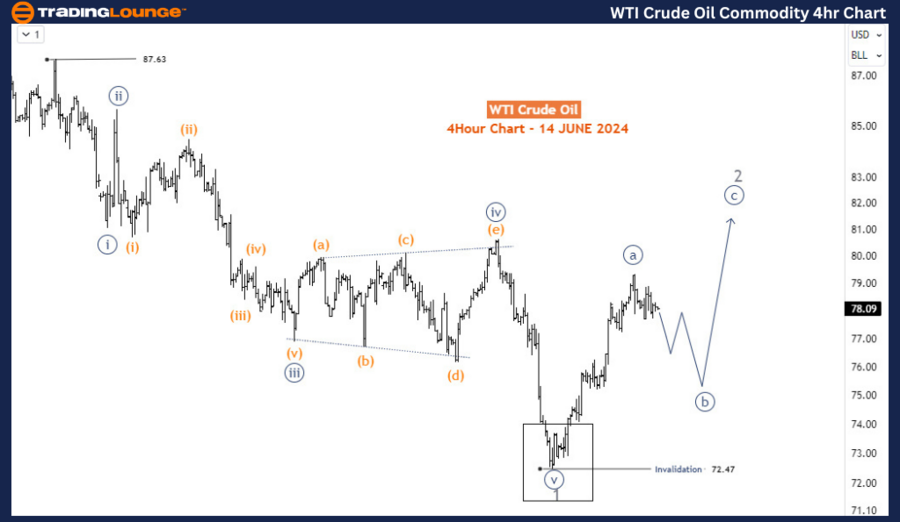
The H4 chart indicates that wave 2 has not yet finished and could reach higher prices in the 80s region in the next few weeks. Currently, wave 2 appears to be completing its first leg, wave a (circled). After this, a pullback is expected for wave b (circled), which should stay above 72.47 before the final leg to complete wave 2 in the 80s region.

Unless there is a breach above 87.63, the medium-term direction is expected to be downwards after the wave 2 corrective bounce.

Technical Analyst: Sanmi Adeagbo

Source: visit Tradinglounge.com and learn From the Experts Join TradingLounge Here 

See Previous: Corn Elliott Wave Technical Analysis

Special Trial Offer - 0.76 Cents a Day for 3 Months! Click here

Access 7 Analysts Over 170 Markets Covered. Chat Room With Support
WTI-Crude-Oil-Commod...

Summary

Crude oil prices are experiencing a recovery in June after a significant decline. The current recovery is anticipated to continue but is likely to be capped below the April 2024 highs. The long-term bearish correction that started in March 2022 appears to be ongoing. On the daily chart, the bearish corrective cycle is forming a double zigzag pattern, with wave Y currently in progress. The H4 chart suggests that wave 2 is nearing completion and could reach the 80s region. After this corrective bounce, the medium-term outlook remains bearish unless the price breaches 87.63.

Traders should monitor the key levels of 87.63 and 72.47 to identify potential entry and exit points, as well as to confirm the continuation of the bearish trend after the wave 2 correction.

Related

Watch CAT Stock Progresses through its Current Market Structure Using Caterpillar Inc. (CAT) Elliott Wave Technical Analysis

Watch CAT Stock Progresses through its Current Market Structure Using Caterpillar Inc. (CAT) Elliott Wave Technical Analysis

This article provides a comprehensive Elliott Wave analysis of Caterpillar Inc. (CAT), examining bot...

Read More >
Bitcoin / U.S. dollar(BTCUSD) Elliott Wave Technical Analysis 13 November 23

Bitcoin / U.S. dollar(BTCUSD) Elliott Wave Technical Analysis 13 November 23

Bitcoin/U.S. dollar(BTCUSD) Elliott Wave Technical Analysis on 13 November 23 with BTCUSD Analysis D...

Read More >
USDCHF Elliott Wave Analysis: Daily and 4-Hour Insights, Corrective Waves, Trading Strategies, Market Trends, and Risk Management

USDCHF Elliott Wave Analysis: Daily and 4-Hour Insights, Corrective Waves, Trading Strategies, Market Trends, and Risk Management

This article provides a comprehensive Elliott Wave analysis for USDCHF, covering daily and 4-hour ch...

Read More >
The Elliott Wave Analysis for Texas Instruments Inc. (TXN) Reveals a Bullish Trend, Supported by Both the Daily and 1-hour Charts

The Elliott Wave Analysis for Texas Instruments Inc. (TXN) Reveals a Bullish Trend, Supported by Both the Daily and 1-hour Charts

Our Elliott Wave analysis for Texas Instruments Inc. (TXN) highlights a bullish trend, with both dai...

Read More >
McDonald’s Corp.(MCD) Elliott Wave Technical Analysis: Unveiling Trading Opportunities

McDonald’s Corp.(MCD) Elliott Wave Technical Analysis: Unveiling Trading Opportunities

McDonald’s Corp. (MCD) shows bullish momentum on the daily chart, with resistance at $300 and a pot...

Read More >
British Pound/U.S. Dollar Forex Pair Market Analysis and Detailed Insight on GBPUSD Elliott Wave Technical Analysis

British Pound/U.S. Dollar Forex Pair Market Analysis and Detailed Insight on GBPUSD Elliott Wave Technical Analysis

The GBPUSD Elliott Wave analysis for both the day and 4-hour charts indicates a strong bullish trend...

Read More >

Buy 1 Month

Get 3 Months!

Special Offer:

Trade Recommendations

Unleash the power of deversified trading with our comprehensive portfolio, covering:

  • Stock Trades
  • Crypto Trades
  • Forex Trades
  • Commodity Trades
Elliott Wave Analysis

Gain a competive edge with expert insights in to:

  • Global Indices
  • US Stocks & ASX Stocks
  • Forex & Crypto
  • Commodities
Top-Notch Trading Tools

Equip yourself with the tools of success:

  • Social Chat
  • Elliott Wave Algorithm
  • Screener
  • TradingLevels
  • Trading Game
7 Elliott Wave Analysts

Stay ahead of the market with daily charts and insightful videos
-Your secret to strategic trading!

JOIN HERE


Welcome to TradingLounge (ASIC A.R.No. 321187), specialists in trades, trading education and technical analysis, covering stocks, indices, commodities, forex and cryptocurrencies.

When you join TradingLounge you have access to everything we offer, including trade tools, educational content and a social platform to chat with like-minded investors.

Read more

@Copyright 2024 by tradinglounge.com

Contact Us

Australian no: 02 4787 6020

International no: +61 (2) 47876020

Pay with:

Find us on