In the realm of cryptocurrency trading, understanding Elliott Wave theory can provide valuable insights. Today, we'll delve into the Elliott Wave analysis of AAVE/USD (AAVEUSD) on February 26, shedding light on potential trading strategies and technical indicators.
Elliott Wave Analysis for AAVE/USD (AAVEUSD)
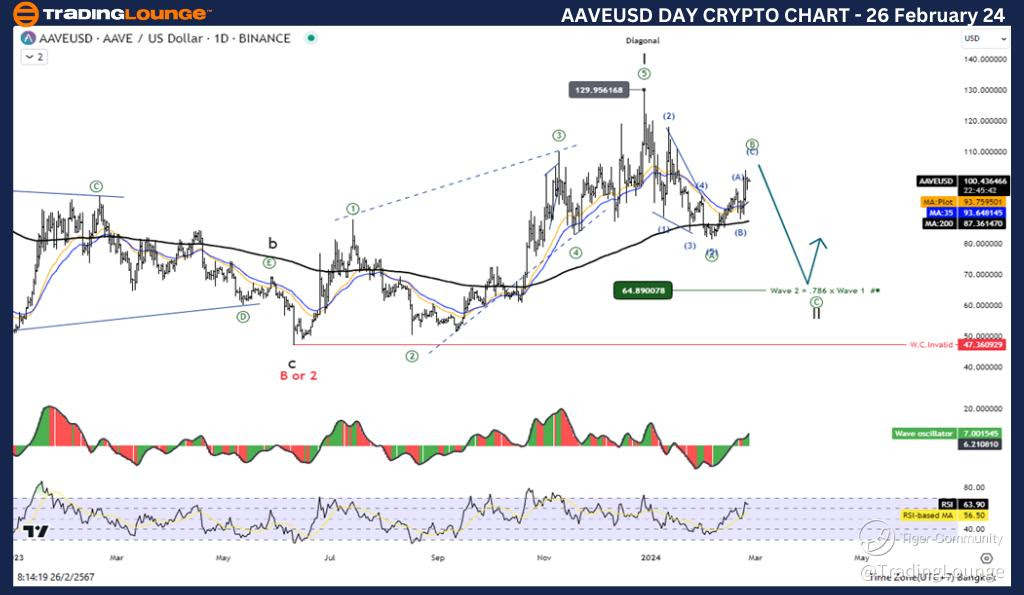
AAVE/ U.S. dollar(AAVEUSD) Daily Chart Analysis
AAVEUSD Elliott Wave Technical Analysis
Function: Counter Trend
Mode: Corrective
Structure: Zigzag
Position: Wave ((B))
Direction Next higher Degrees: Wave II of Impulse
Wave Cancel invalid Level: 47.34
AAVE/USD (AAVEUSD) Technical Analysis Overview: The current Elliott Wave pattern indicates a corrective phase, specifically a Zigzag structure, with the price positioned at Wave ((B)). This suggests a temporary pullback before resuming the upward trend. Notably, Wave II of Impulse is anticipated in the higher degrees, emphasizing the corrective nature of the current movement.
AAVE/USD (AAVEUSD) Trading Strategy: Given the corrective nature of Wave ((B)), traders may consider a cautious approach. The correction within the Zigzag pattern suggests that the price is likely retracing in wave B, with an expectation of further decline in wave C. While the overall trend remains upward, it's essential to navigate through the corrective phase for potential opportunities.
AAVE/USD (AAVEUSD) Technical Indicators:
-
Moving Average (MA200): The price is currently above the MA200, indicating an uptrend in the market sentiment.
-
Wave Oscillator: The Wave Oscillator signals a bullish momentum, aligning with the overarching uptrend.
Insights for AAVE/USD (AAVEUSD) Trading: When considering trading strategies for AAVE/USD, it's crucial to acknowledge the corrective phase within the Zigzag pattern. Traders should exercise caution and look for potential entry points as the price retraces in wave B. Additionally, monitoring the MA200 and Wave Oscillator can offer valuable insights into market trends and momentum, aiding in decision-making processes.
Elliott Wave Analysis for AAVE/USD (AAVEUSD)
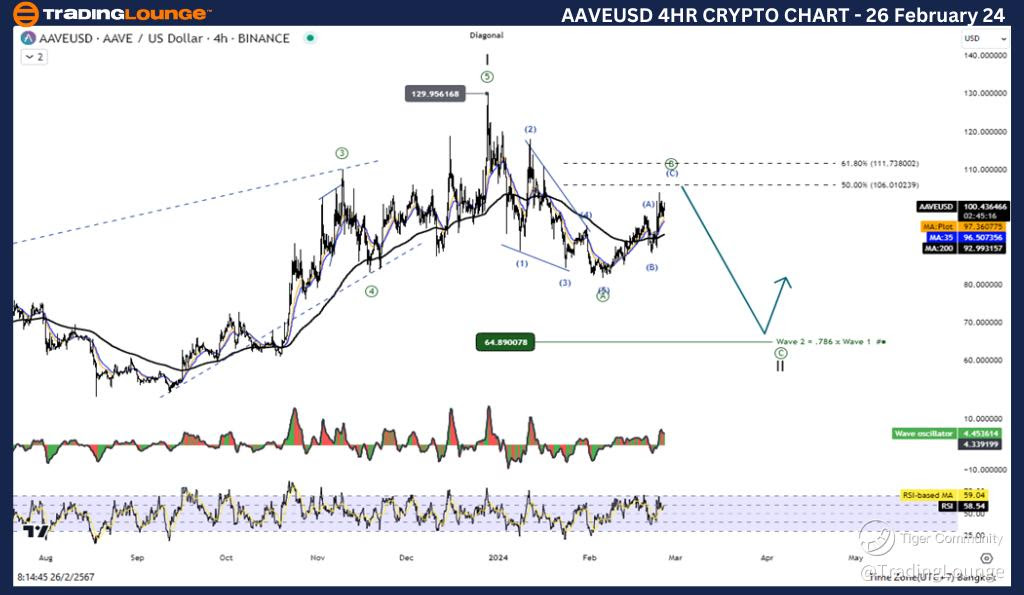
AAVE/ U.S. dollar(AAVEUSD) 4H Chart Analysis
AAVEUSD Elliott Wave Technical Analysis
Function: Counter Trend
Mode: Corrective
Structure: Zigzag
Position: Wave ((B))
Direction Next higher Degrees: Wave II of Impulse
Wave Cancel invalid Level: 47.34
AAVE/USD (AAVEUSD) Technical Analysis Overview: The Elliott Wave analysis of AAVE/USD (AAVEUSD) on February 26 reaffirms the corrective nature of the current market movement. With a Zigzag structure in place and the price positioned at Wave ((B)), traders should be attentive to potential opportunities within this corrective phase. Looking ahead, Wave II of Impulse in the higher degrees indicates a continuation of the overall uptrend.
AAVE/USD (AAVEUSD) Trading Strategy: In navigating the current market conditions, traders should focus on managing the corrective phase effectively. As the price retraces in wave B within the Zigzag pattern, there may be opportunities for strategic entries before the anticipated wave C decline. While the broader trend remains upward, exercising patience and diligence during corrections is paramount.
AAVE/USD (AAVEUSD) Technical Indicators:
-
Moving Average (MA200): The MA200 serves as a key indicator, with the price holding above it, signaling an ongoing uptrend.
-
Wave Oscillator: The bullish momentum depicted by the Wave Oscillator reinforces the positive market sentiment and potential for further upside movement.
Insights for AAVE/USD (AAVEUSD) Trading:
With the Elliott Wave analysis providing a roadmap for market behavior, traders can adapt their strategies accordingly. By understanding the corrective nature of the current Zigzag pattern and utilizing technical indicators such as the MA200 and Wave Oscillator, traders can navigate the market with confidence and precision. As the correction unfolds, staying vigilant for optimal entry and exit points is essential for maximizing profitability and minimizing risk.
Technical Analyst: Kittiampon Somboonsod, CEWA
Source: visit Tradinglounge.com and learn From the Experts Join TradingLounge Here
See Previous: Ethereum/ U.S. dollar(ETHUSD)